The Cost Seg Smart Rental Property Opportunity Index 2026
A proprietary ranking of U.S. markets based on property values, investor and vacation-home ownership, and rental-market characteristics associated with cost segregation opportunity. We screened 6,470 U.S. markets, scored 399, and published the top 50.
- Markets screened
- 6,470
- Markets scored
- 399
- States in the top 50
- 24
- Data vintage
- ACS 2023 5-year
What the data shows
The index contains two opposite kinds of market, and they score almost the same
The single factor that most separates the top 50 is not price. It is what the housing is for. 29 of the 50 markets are second-home markets, where property is held for seasonal or occasional use and long-term renters are nearly absent. The rest are long-term rental markets, where the seasonal share rounds to zero. Avalon, New Jersey sits at #1 with 79.1% of its housing held for seasonal use and 0.8% occupied by long-term renters. Santa Monica sits at #2 with 63.2% long-term renters and 1.5% seasonal. They score within 0.005 of each other on the composite and have almost nothing else in common.
That distinction matters more than the ranking does. A long-term rental and a second home that is sometimes rented are different situations before a study ever begins, and the questions that decide whether cost segregation is worth doing at all differ between them. Read the archetype column in the table below before you read the rank.
Scatter plot of long-term renter share against seasonal-use share for the top 50 markets. Points cluster tightly along the two axes with almost nothing in the middle: second-home markets such as Avalon, Sunriver and Surf City sit high on the seasonal axis with near-zero rental share, while Santa Monica, West Hollywood, Cambridge and Addison sit far right with near-zero seasonal share. Every value plotted here is listed in the full top-50 table below.
A high median price is not the same thing as a high depreciable basis
Cost segregation reclassifies components of the improvement portion of a property. Land is not depreciable, and it is never reclassified. That means the headline median value of a market and the amount of basis a study can actually work with are two different quantities, and they diverge most in exactly the markets that rank highest on price: dense, land-constrained coastal metros, where a large share of what a buyer pays is for the dirt rather than the structure on it.
This index deliberately does not attempt to model land share per market. Doing so credibly requires property-level assessor or appraisal evidence, and publishing a modeled land ratio as though it were measured data would misrepresent an assumption as a finding. What the index measures is measured. The consequence is that two markets with the same median value can offer materially different depreciable basis, and the ranking cannot tell you which is which.
Search demand is the weakest of the three factors, and we are telling you so
Investor search volume carries the smallest weight (0.25) for a reason. Raw search volume tracks a city's population at least as much as it tracks investor interest, which is why New York and Seattle appear on demand strength while genuinely concentrated markets like Montauk and Sea Isle City register almost nothing under their own names. For most markets in the index the monthly volumes are small and heavily rounded. We report demand as a tier rather than a number for that reason. The two Census-measured factors are what the ranking mostly rests on.
How the index is built
Every input is a measured quantity from a public source. There are no editorial adjustments, no hand-picked candidate list, and no bonus for markets we happen to write about.
| Factor | Weight | Source | Why it is in the index |
|---|---|---|---|
| Median home value | 0.40 | ACS 2023 5-yr, table B25077 | Depreciable basis scales with property value. Higher-value markets put more basis in play per property. |
| Investor / second-home density | 0.35 | ACS B25003 + B25004 / B25002 | Share of housing that is renter-occupied or held for seasonal use. Owner-occupied primary residences are not cost segregation candidates. |
| Investor search demand | 0.25 | Google Ads monthly search volume | Combined volume for "[city] short term rental" and "[city] investment property". Evidence of an active investor market rather than merely expensive housing. |
The screen
The candidate universe is not a list we chose. It is every U.S. Census place, plus every town in the six New England states, that meets two thresholds: at least 2,500 housing units and at least 500 owner-occupied homes. The first keeps ACS five-year medians statistically meaningful. The second requires that a real for-sale housing market exists; without it, university housing tracts screen in at the very top on renter share alone, since their housing is institutionally owned and cannot be bought by an investor. That screen produced 6,470 markets.
New England is measured at the town level rather than the place level because in those six states the town is the functioning local government and Census "places" are mostly subdivisions nested inside towns. Mixing the two would double-count. This is also what allows Nantucket, Edgartown and the Cape Cod towns to appear at their true granularity instead of dissolving into a county-wide median.
Each factor is converted to a percentile rank rather than a min-max scale, because a handful of markets at the Census top-code would otherwise compress every other market into the bottom of the range. The 400 strongest markets on the two nationwide factors advanced to be scored on all three.
The state cap, and why the raw ranking is also published
Scored purely on the composite, the top 50 is extremely concentrated: 22 of 50
would be in California and only 11 states would appear at all. That concentration
is a real property of the data and we publish it in full in the
CSV and under
unconstrained_top50 in the
JSON. But it makes a poor
national list. The published ranking therefore caps each state at
3 markets, which brings 24 states into the
top 50. The cap changes which markets are listed. It never changes a market's score.
- Stanford CDP, CA — University-owned campus housing; homes sit on institutional ground leases and are not available to outside investors.
Grid-tile map of the United States shading each state by the number of markets it placed in the top 50, from none up to the three-market cap.
The full top 50
Sorted by composite score. Archetype reports whether a market's investor housing is predominantly second-home or long-term rental. Markets marked ≥ $2,000,001 hit the Census top-code, so their true median is censored and unknown.
| # | Market | Archetype | Median value | Investor density | Rental / 2nd-home | Search demand | Score | Local guide |
|---|---|---|---|---|---|---|---|---|
| 1 | Avalon, NJ | Second-home | $1,756,100 | 79.9% | 0.8% / 79.1% | Low | 0.926 | Avalon guide |
| 2 | Santa Monica, CA | Long-term rental | $1,810,200 | 64.6% | 63.2% / 1.5% | Moderate | 0.922 | Santa Monica guide |
| 3 | Nantucket, MA | Second-home | $1,387,000 | 66.2% | 9.5% / 56.7% | Low | 0.900 | Nantucket guide |
| 4 | Southampton, NY | Second-home | ≥ $2,000,001 | 60.3% | 6.8% / 53.5% | Low | 0.871 | Southampton guide |
| 5 | West Hollywood, CA | Long-term rental | $969,900 | 71.7% | 70.6% / 1.1% | Low | 0.858 | West Hollywood guide |
| 6 | Santa Barbara, CA | Long-term rental | $1,466,400 | 58.6% | 56.5% / 2.1% | Moderate | 0.851 | Santa Barbara guide |
| 7 | Rehoboth Beach, DE | Second-home | $1,238,400 | 75.1% | 4.5% / 70.5% | Minimal | 0.850 | — |
| 8 | Park City, UT | Second-home | $1,739,700 | 57.6% | 10.1% / 47.5% | Low | 0.825 | Park City guide |
| 9 | Vail, CO | Second-home | $1,040,100 | 65.5% | 10.8% / 54.7% | Minimal | 0.825 | Vail guide |
| 10 | Cambridge, MA | Long-term rental | $1,040,500 | 62.0% | 60.2% / 1.8% | Low | 0.811 | Cambridge guide |
| 11 | Lavallette, NJ | Second-home | $1,045,200 | 71.1% | 5.4% / 65.7% | Minimal | 0.806 | Lavallette guide |
| 12 | Kiawah Island, SC | Second-home | $1,723,200 | 61.1% | 0.5% / 60.6% | Minimal | 0.801 | Kiawah Island guide |
| 13 | Surf City, NJ | Second-home | $967,900 | 74.5% | 2.0% / 72.5% | Minimal | 0.796 | New Jersey guide |
| 14 | Frisco, CO | Second-home | $839,500 | 66.7% | 16.5% / 50.2% | Low | 0.788 | Frisco guide |
| 15 | New York, NY | Long-term rental | $751,700 | 63.0% | 61.0% / 2.0% | High | 0.762 | New York guide |
| 16 | Breckenridge, CO | Second-home | $757,100 | 65.3% | 7.3% / 58.1% | Low | 0.747 | Breckenridge guide |
| 17 | Somerville, MA | Long-term rental | $899,400 | 62.2% | 61.9% / 0.3% | Minimal | 0.730 | Massachusetts guide |
| 18 | Jackson, WY | Long-term rental | $1,228,700 | 55.6% | 44.6% / 11.0% | Minimal | 0.726 | Jackson guide |
| 19 | Naples, FL | Second-home | $1,254,200 | 49.1% | 8.8% / 40.3% | Moderate | 0.722 | Naples guide |
| 20 | Montauk, NY | Second-home | $1,186,400 | 68.5% | 6.9% / 61.7% | Minimal | 0.720 | New York guide |
| 21 | Palm Beach, FL | Second-home | $1,996,700 | 52.1% | 9.0% / 43.1% | Minimal | 0.718 | Palm Beach guide |
| 22 | Seattle, WA | Long-term rental | $912,100 | 52.5% | 51.4% / 1.1% | High | 0.717 | Seattle guide |
| 23 | Bal Harbour, FL | Second-home | $1,277,200 | 63.1% | 12.6% / 50.5% | Minimal | 0.709 | Florida guide |
| 24 | Wrightsville Beach, NC | Second-home | $1,041,800 | 55.8% | 8.3% / 47.5% | Minimal | 0.697 | North Carolina guide |
| 25 | Redmond, WA | Long-term rental | $1,091,700 | 52.0% | 51.8% / 0.2% | Minimal | 0.657 | Redmond guide |
| 26 | Incline Village, NV | Second-home | $1,315,700 | 57.7% | 16.1% / 41.6% | Minimal | 0.657 | Incline Village guide |
| 27 | Bellevue, WA | Long-term rental | $1,203,100 | 45.5% | 45.1% / 0.4% | Low | 0.637 | Bellevue guide |
| 28 | Washington, DC | Long-term rental | $724,600 | 54.0% | 53.1% / 0.8% | Low | 0.637 | Washington guide |
| 29 | Big Sky, MT | Second-home | $884,700 | 62.6% | 5.1% / 57.5% | Minimal | 0.627 | Montana guide |
| 30 | Sunriver, OR | Second-home | $719,800 | 82.2% | 1.6% / 80.6% | Minimal | 0.613 | Oregon guide |
| 31 | Emerald Isle, NC | Second-home | $563,600 | 74.2% | 4.5% / 69.7% | Minimal | 0.574 | North Carolina guide |
| 32 | Falls Church, VA | Long-term rental | $1,005,400 | 47.4% | 47.4% / 0.0% | Minimal | 0.568 | Virginia guide |
| 33 | Alexandria, VA | Long-term rental | $696,800 | 54.9% | 54.2% / 0.6% | Minimal | 0.559 | Virginia guide |
| 34 | Bozeman, MT | Long-term rental | $614,900 | 53.4% | 51.5% / 1.9% | Low | 0.551 | Bozeman guide |
| 35 | Princeville, HI | Second-home | $1,215,000 | 49.4% | 8.8% / 40.7% | Minimal | 0.541 | Hawaii guide |
| 36 | South Padre Island, TX | Second-home | $498,800 | 80.3% | 8.8% / 71.5% | Minimal | 0.540 | Texas guide |
| 37 | Arlington, VA | Long-term rental | $864,800 | 54.7% | 53.7% / 1.0% | Minimal | 0.539 | Arlington guide |
| 38 | Ketchum, ID | Second-home | $756,200 | 58.3% | 12.0% / 46.3% | Minimal | 0.527 | Idaho guide |
| 39 | Warren, VT | Second-home | $486,500 | 72.4% | 4.5% / 67.9% | Minimal | 0.517 | — |
| 40 | Addison, TX | Long-term rental | $466,000 | 76.5% | 76.5% / 0.0% | Minimal | 0.514 | Texas guide |
| 41 | Flagstaff, AZ | Long-term rental | $503,400 | 57.6% | 51.3% / 6.3% | Moderate | 0.506 | Arizona guide |
| 42 | Stamford, CT | Long-term rental | $614,300 | 49.8% | 49.0% / 0.8% | Low | 0.497 | Stamford guide |
| 43 | Newport, RI | Long-term rental | $669,500 | 51.3% | 39.8% / 11.5% | Minimal | 0.492 | — |
| 44 | Wailea, HI | Second-home | $1,363,700 | 45.6% | 15.7% / 29.9% | Minimal | 0.489 | Hawaii guide |
| 45 | Austin, TX | Long-term rental | $512,700 | 53.2% | 52.4% / 0.7% | High | 0.483 | Austin guide |
| 46 | McCall, ID | Second-home | $564,500 | 74.6% | 6.4% / 68.1% | Minimal | 0.481 | Idaho guide |
| 47 | Snyderville, UT | Second-home | $995,900 | 47.7% | 12.4% / 35.4% | Minimal | 0.475 | Utah guide |
| 48 | Napili-Honokowai, HI | Long-term rental | $775,500 | 52.1% | 26.7% / 25.4% | Minimal | 0.473 | Hawaii guide |
| 49 | Narragansett, RI | Second-home | $665,800 | 50.2% | 18.4% / 31.8% | Minimal | 0.473 | — |
| 50 | Seabrook Island, SC | Second-home | $899,600 | 48.6% | 2.7% / 46.0% | Minimal | 0.469 | South Carolina guide |
Source: Cost Seg Smart Rental Property Opportunity Index 2026. ACS 2023 5-year estimates; Google Ads monthly search volume. Download the full 399-market CSV.
Horizontal bar chart of composite scores for all 50 ranked markets, coloured by whether each market is second-home dominant or long-term-rental dominant. The same scores appear in the table above.
The countdown: 50 to 21
Every market below cleared a screen that 6,071 others did not. These are the markets that qualified on the measured factors without reaching the top 20.
- $899,600 median 48.6% investor density 2,522 units Minimal demand
Seabrook Island's housing stock is almost entirely owner-occupied or seasonal, with renter-occupied units at just 2.7% against 46% seasonal or second-home stock. A $899,600 median value and zero recorded search volume for rental or investment terms placed it last in the top 50 with a composite of 0.47.
- #49
Narragansett, RI
Second-home$665,800 median 50.2% investor density 9,615 units Minimal demandNarragansett's 50% investor density leans toward seasonal use, with second-home units (32%) outnumbering long-term rentals (18% renter-occupied) by nearly two to one. Its $665,800 median value and 10 monthly searches for rental or investment terms round out a composite of 0.47, among the lowest of the top 50.
- $775,500 median 52.1% investor density 4,079 units Minimal demand
Napili-Honokowai shows one of the more balanced splits in the index: renter-occupied units (27%) and seasonal or second-home units (25%) contribute almost equally to its 52% investor density. A $775,500 median value and zero search volume for rental or investment terms produced a composite of 0.47.
- $995,900 median 47.7% investor density 4,218 units Minimal demand
Snyderville's $995,900 median value is comparatively high for this band, but investor density of 48% and zero recorded search volume kept its composite near the bottom of the top 50. Seasonal and second-home units (35%) outnumber long-term rentals (12% renter-occupied) nearly three to one, a Park City-adjacent ski pattern.
- $564,500 median 74.6% investor density 4,292 units Minimal demand
McCall's 75% investor density is among the higher readings in this band, built almost entirely on seasonal and second-home units (68%) that far outweigh long-term rentals (6% renter-occupied). A $564,500 median value and zero measured search volume for rental or investment terms together held its composite to 0.48.
- $512,700 median 53.2% investor density 466,428 units High demand
Austin recorded 1,440 monthly searches for rental and investment terms, a High demand tier matched by only two other markets in the full index, against a $512,700 median value. Investor density of 53% is almost entirely long-term rental housing (52% renter-occupied), with seasonal stock under 1%, a big-metro rental signature.
- $1,363,700 median 45.6% investor density 6,125 units Minimal demand
Wailea's $1,363,700 median value is among the highest in this band, yet investor density of 46% is among the lowest, and zero search volume was recorded for rental or investment terms. Seasonal and second-home units (30%) still outnumber long-term rentals (16% renter-occupied) by roughly two to one.
- #43
Newport, RI
Long-term rental$669,500 median 51.3% investor density 13,527 units Minimal demandNewport blends 40% renter-occupied housing with 11% seasonal stock for a combined investor density of 51%, a more even split than most coastal markets in this band. Its $669,500 median value and just 10 monthly searches for rental or investment terms kept the composite at 0.49.
- $614,300 median 49.8% investor density 57,958 units Low demand
Stamford's investor density of 50% is composed almost entirely of long-term rental housing (49% renter-occupied), with seasonal stock at under 1% of units. A $614,300 median value combined with 180 monthly searches for rental or investment terms produced a composite of 0.50, a mid-pack commuter-suburb signature.
- $503,400 median 57.6% investor density 31,466 units Moderate demand
Flagstaff logged 220 monthly searches for rental and investment terms, a Moderate demand tier that outpaces nearly all of this band, against a $503,400 median value. Investor density of 58% is mostly long-term rental housing (51% renter-occupied) with a modest seasonal component (6%), reflecting a university-town rental market.
- $466,000 median 76.5% investor density 10,772 units Minimal demand
Addison's entire 77% investor density traces to long-term rental housing, with renter-occupied units also at 77% and zero seasonal or second-home stock recorded, an apartment-heavy Dallas-suburb profile. A $466,000 median value is among the lowest measured in the index, which held the composite to 0.51 despite the density reading.
- #39
Warren, VT
Second-home$486,500 median 72.4% investor density 2,505 units Minimal demandWarren's 72% investor density is driven almost entirely by seasonal and second-home units (68%) against just 5% renter-occupied, a Mad River Valley ski-country pattern. Its $486,500 median value is among the lowest in the index, which pulled the composite down despite the high density reading.
- $756,200 median 58.3% investor density 4,334 units Minimal demand
Ketchum's 58% investor density splits heavily toward seasonal use, with second-home units (46%) outnumbering long-term rentals (12% renter-occupied) by nearly four to one. A $756,200 median value combined with zero measured search volume for rental or investment terms placed its composite at 0.53, a resort-town profile.
- $864,800 median 54.7% investor density 120,746 units Minimal demand
Arlington's investor density of 55% is almost entirely renter-occupied housing (54%), with seasonal stock at just 1%, typical of a dense DC-suburb rental market. A $864,800 median value is mid-range for the index, but zero recorded search volume for rental or investment terms limited the composite to 0.54.
- $498,800 median 80.3% investor density 5,843 units Minimal demand
South Padre Island's 80% investor density is among the highest measured, built almost entirely on seasonal and second-home units (72%) rather than long-term rentals (9% renter-occupied). Its $498,800 median value ranks near the bottom of the index, keeping the composite well below markets with comparable density.
- $1,215,000 median 49.4% investor density 2,703 units Minimal demand
Princeville's $1,215,000 median value is among the higher figures in this band, but investor density of 49% and zero recorded search volume held its composite to 0.54. Seasonal and second-home units (41%) outnumber long-term rentals (9% renter-occupied) by more than four to one, a North Shore Kauai second-home pattern.
- $614,900 median 53.4% investor density 24,846 units Low demand
Bozeman shows 180 monthly searches for rental and investment terms, a stronger demand signal than most markets in this band, against a $614,900 median value. Investor density of 53% is overwhelmingly long-term rental housing (52% renter-occupied) rather than seasonal stock (2%), consistent with a university-and-outdoor-recreation rental market.
- $696,800 median 54.9% investor density 80,570 units Minimal demand
Alexandria pairs a $696,800 median value with 55% investor density, nearly all of it long-term rental stock at 54% renter-occupied. Seasonal units are negligible at 0.6%, and just 10 monthly searches for rental or investment terms held the composite to 0.56, reflecting a stable but low-demand-signal rental market.
- $1,005,400 median 47.4% investor density 6,360 units Minimal demand
Falls Church reports zero seasonal or second-home units, one of only two markets in this band where investor density is composed entirely of long-term rental housing (47% renter-occupied against 47% overall density). Its $1,005,400 median value is solid, but only 10 monthly searches for rental or investment terms limited the composite to 0.57.
- $563,600 median 74.2% investor density 6,802 units Minimal demand
Emerald Isle's 74% investor density ranks among the higher readings in this band, but a $563,600 median value is comparatively low, capping its overall composite. Seasonal and second-home units make up 70% of the housing stock against just 5% renter-occupied, a classic barrier-island vacation-property pattern.
- $719,800 median 82.2% investor density 4,862 units Minimal demand
Sunriver posts the highest investor density in this rank band at 82%, driven almost entirely by seasonal and second-home units (81%) rather than long-term rentals (2% renter-occupied). Its $719,800 median value is comparatively modest, and zero recorded search volume kept the composite from climbing higher.
- $884,700 median 62.6% investor density 3,118 units Minimal demand
Big Sky's 63% investor density is one of the higher readings among rank 21-50 markets, though it recorded zero measured search volume for rental or investment terms. Seasonal and second-home units account for 58% of housing against only 5% renter-occupied, making this a mountain second-home market rather than a rental one.
- $724,600 median 54.0% investor density 356,101 units Low demand
Washington, DC's $724,600 median value is the lowest of the top 28 markets, but 180 monthly searches keep its demand signal comparable to much pricier metros. Investor density of 54% tracks almost entirely to renter-occupied housing (53%), with seasonal stock at just 0.8%, a dense urban-rental pattern.
- $1,203,100 median 45.5% investor density 65,536 units Low demand
Bellevue combines a $1,203,100 median value with 180 monthly investor-related searches, a modest demand reading that still exceeds most markets in this band. Its 45% investor density is composed almost exclusively of long-term rental housing, with seasonal stock at under half a percent of units, a dense Eastside employment-market profile rather than a second-home one.
- $1,315,700 median 57.7% investor density 7,719 units Minimal demand
Incline Village posts a $1,315,700 median value with 58% investor density but zero recorded search volume for rental or investment terms. Within that density, seasonal and second-home units (42%) outweigh long-term rentals (16% renter-occupied) by more than two to one, marking a Tahoe-basin second-home pattern.
- $1,091,700 median 52.0% investor density 33,884 units Minimal demand
Redmond's $1,091,700 median value is offset by minimal measured search demand of just 10 monthly searches, pulling its composite down despite solid fundamentals. Investor density of 52% is almost entirely renter-occupied housing (52%) with negligible seasonal stock (0.2%), consistent with a tech-metro rental market rather than a second-home destination.
- $1,041,800 median 55.8% investor density 2,926 units Minimal demand
Wrightsville Beach shows a $1,041,800 median value paired with 56% investor density, split heavily toward seasonal use rather than long-term leasing. Seasonal and second-home units account for 47% of the housing stock against just 8% renter-occupied, characteristic of a coastal vacation-property market rather than a rental-heavy one.
- $1,277,200 median 63.1% investor density 3,629 units Minimal demand
Bal Harbour combines a $1,277,200 median value with 63% investor density, among the higher combined readings in this band. That density is driven almost entirely by seasonal and second-home units (50%) rather than long-term rentals (13% renter-occupied), and the market recorded zero measured search volume for investor terms.
- $912,100 median 52.5% investor density 382,933 units High demand
Seattle's composite score of 0.72 leans heavily on demand: 1,630 monthly searches for rental-related terms rank among the highest in the full index. Renter-occupied units make up 51% of housing stock versus just 1% seasonal, reflecting a dense long-term rental market rather than a vacation-home one.
- $1,996,700 median 52.1% investor density 10,450 units Minimal demand
Palm Beach's $1,996,700 median value sits just under the Census top-code, placing it among the highest-value markets in the index, yet its 52% investor density is moderate for a market that expensive. Nearly 43% of housing units are seasonal or second-home stock against just 9% renter-occupied, marking this an owner and second-home market rather than a landlord-heavy one.
20 to 11
- #20
Montauk, NY
Median value$1,186,400Investor density68.5%Long-term rental6.9%Second-home61.7%Housing units4,565Composite0.720Montauk concentrates 61.7% of its 4,565 units in seasonal use with 6.9% long-term rental, at a $1,186,400 median. It registers no measurable investor search volume under its own name, which is a limitation of the demand factor for hamlets that sit inside a larger, better-known market rather than an indication of inactivity.
- #19
Naples, FL
Median value$1,254,200Investor density49.1%Long-term rental8.8%Second-home40.3%Housing units18,720Composite0.722Naples pairs a $1,254,200 median with a 40.3% seasonal share across 18,720 units, giving it more scale than any other second-home market in the top twenty except Nantucket. Its 8,133 owner-occupied primary residences and moderate search demand describe an established retirement and seasonal market rather than a resort enclave.
- #18
Jackson, WY
Median value$1,228,700Investor density55.6%Long-term rental44.6%Second-home11.0%Housing units5,146Composite0.726Jackson is unusual among mountain markets for leaning rental rather than seasonal: 44.6% of its 5,146 units are renter-occupied against only 11.0% seasonal, an inversion of the Vail and Breckenridge pattern. Its $1,228,700 median is the highest of any market in the Mountain West here, reflecting a constrained valley where most land is federally held.
- #17
Somerville, MA
Median value$899,400Investor density62.2%Long-term rental61.9%Second-home0.3%Housing units37,583Composite0.730Somerville records the most extreme single-purpose housing stock of any large market measured: 61.9% long-term rental and a seasonal share of 0.3%, effectively zero, across 37,583 units. At a $899,400 median it is a dense, entirely year-round rental market directly adjacent to Cambridge, and the two form the largest rental-dominated pair in the index outside California.
- #16
Breckenridge, CO
Median value$757,100Investor density65.3%Long-term rental7.3%Second-home58.1%Housing units7,719Composite0.747Breckenridge holds a 58.1% seasonal share across 7,719 units at a $757,100 median, the lowest value in the top twenty aside from New York. Its 7.3% long-term rental share is thinner than neighboring Frisco's, marking it as the more second-home-weighted of the two Summit County markets in this ranking.
- #15
New York, NY
Median value$751,700Investor density63.0%Long-term rental61.0%Second-home2.0%Housing units3,649,896Composite0.762New York enters at fifteen on a basis no other market can match — 3,649,896 housing units, 61.0% of them renter-occupied — paired with by far the strongest investor search demand measured in the index. Its $751,700 median is the lowest in the top twenty, a reminder that the index rewards ownership structure and scale, not price alone.
- #14
Frisco, CO
Median value$839,500Investor density66.7%Long-term rental16.5%Second-home50.2%Housing units3,649Composite0.788Frisco shows the most balanced mountain profile in the top twenty: 50.2% seasonal alongside 16.5% long-term rental across 3,649 units, the highest rental share of any Colorado market here. Its $839,500 median is modest by top-twenty standards, and its ranking rests on having both a second-home stock and a working year-round one.
- #13
Surf City, NJ
Median value$967,900Investor density74.5%Long-term rental2.0%Second-home72.5%Housing units2,555Composite0.796Surf City carries a 72.5% seasonal share across just 2,555 units, one of the highest concentrations measured anywhere, with 2.0% long-term rental and 587 owner-occupied homes. At a $967,900 median it ranks on ownership structure rather than price, and it is among the smallest markets to clear the 2,500-unit screen.
- Median value$1,723,200Investor density61.1%Long-term rental0.5%Second-home60.6%Housing units3,896Composite0.801
Kiawah Island posts the second-lowest long-term rental share in the entire index at 0.5% — roughly 20 renter-occupied units — while 60.6% of its 3,896 units are seasonal. Its $1,723,200 median makes it the highest-value market in the Southeast on this index, a resort-island ownership pattern with essentially no year-round rental market.
- #11
Lavallette, NJ
Median value$1,045,200Investor density71.1%Long-term rental5.4%Second-home65.7%Housing units2,980Composite0.806Lavallette concentrates 65.7% of its 2,980 units in seasonal or occasional use against 5.4% long-term rental, at a $1,045,200 median. It is the third Jersey Shore borough in the top fifteen, and like the others it holds only a few hundred year-round owner-occupied homes.
The top 10
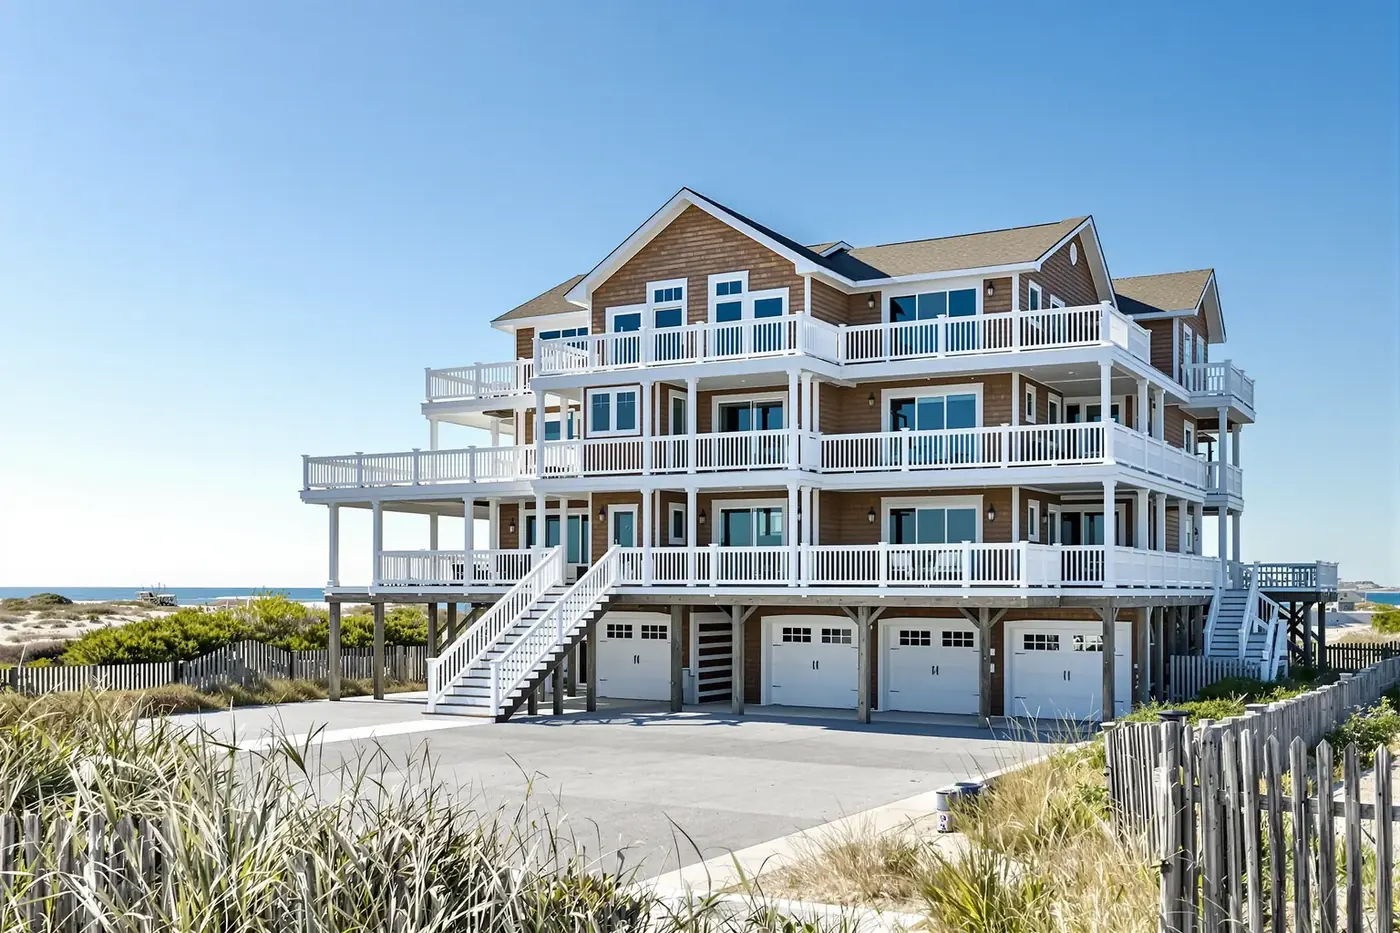
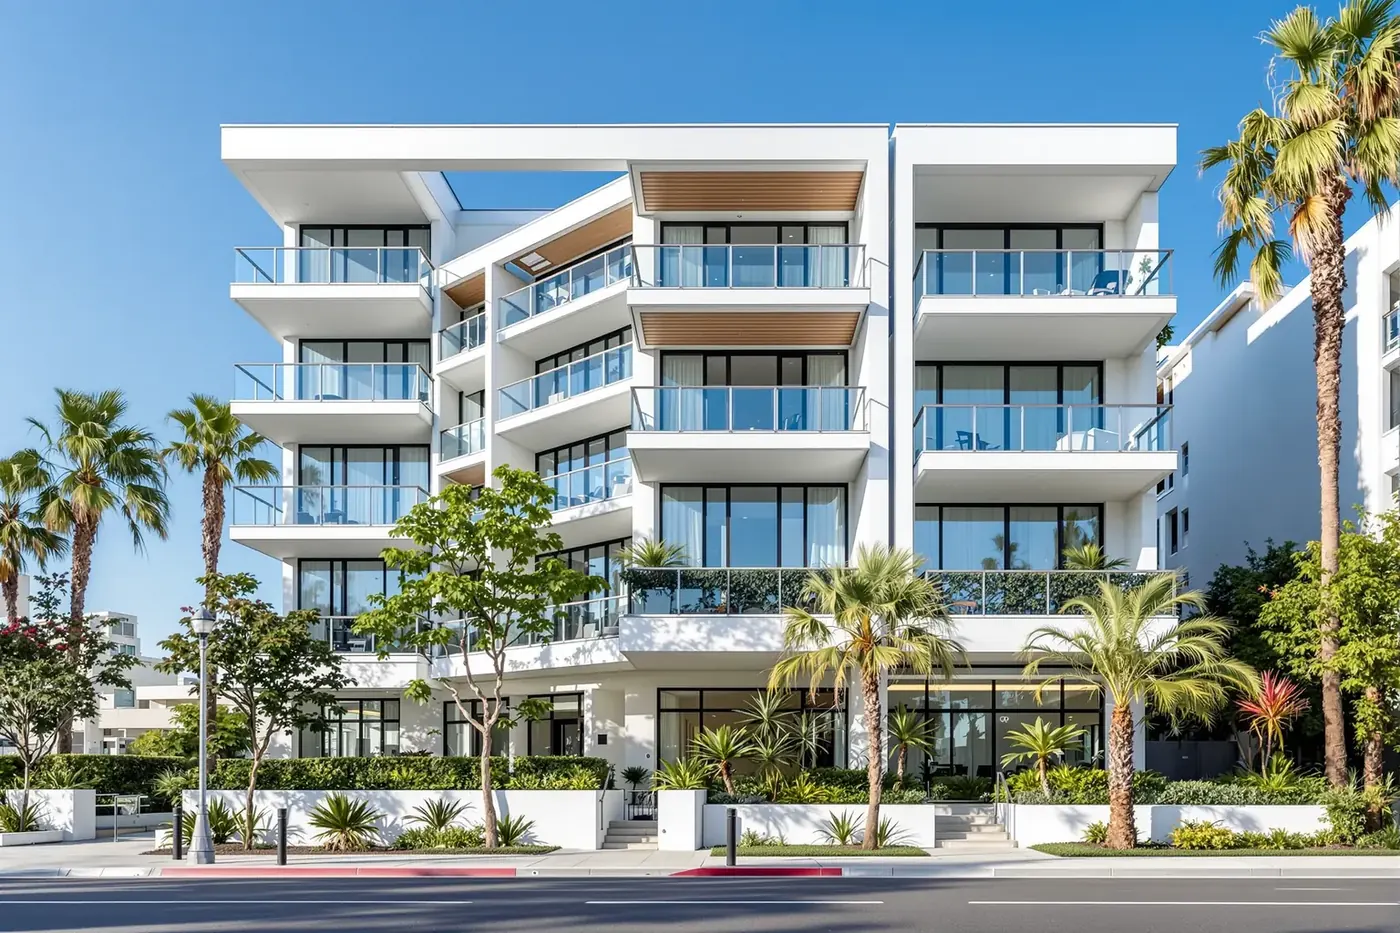
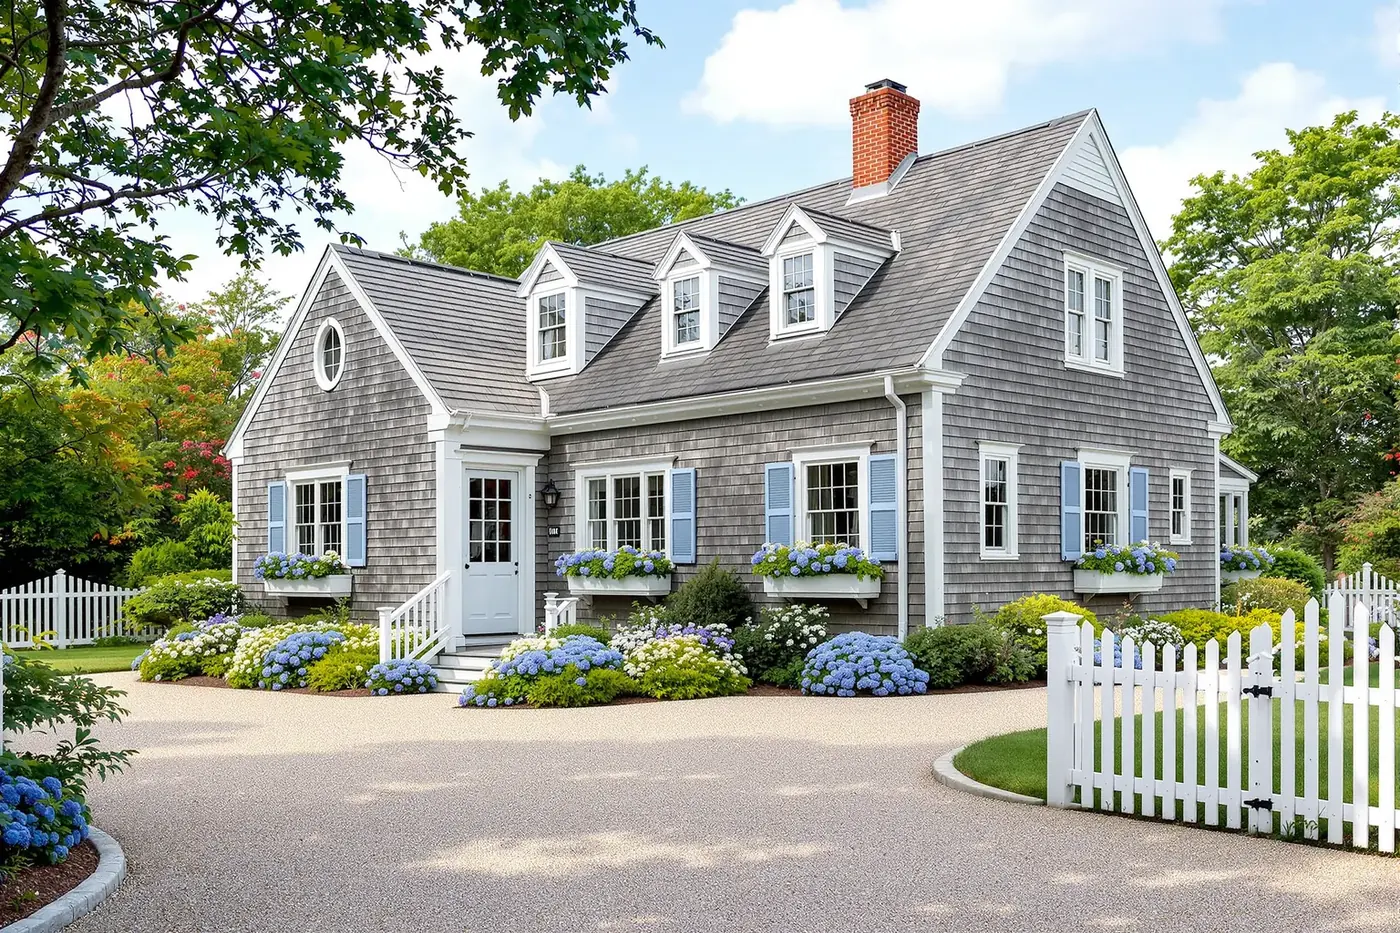
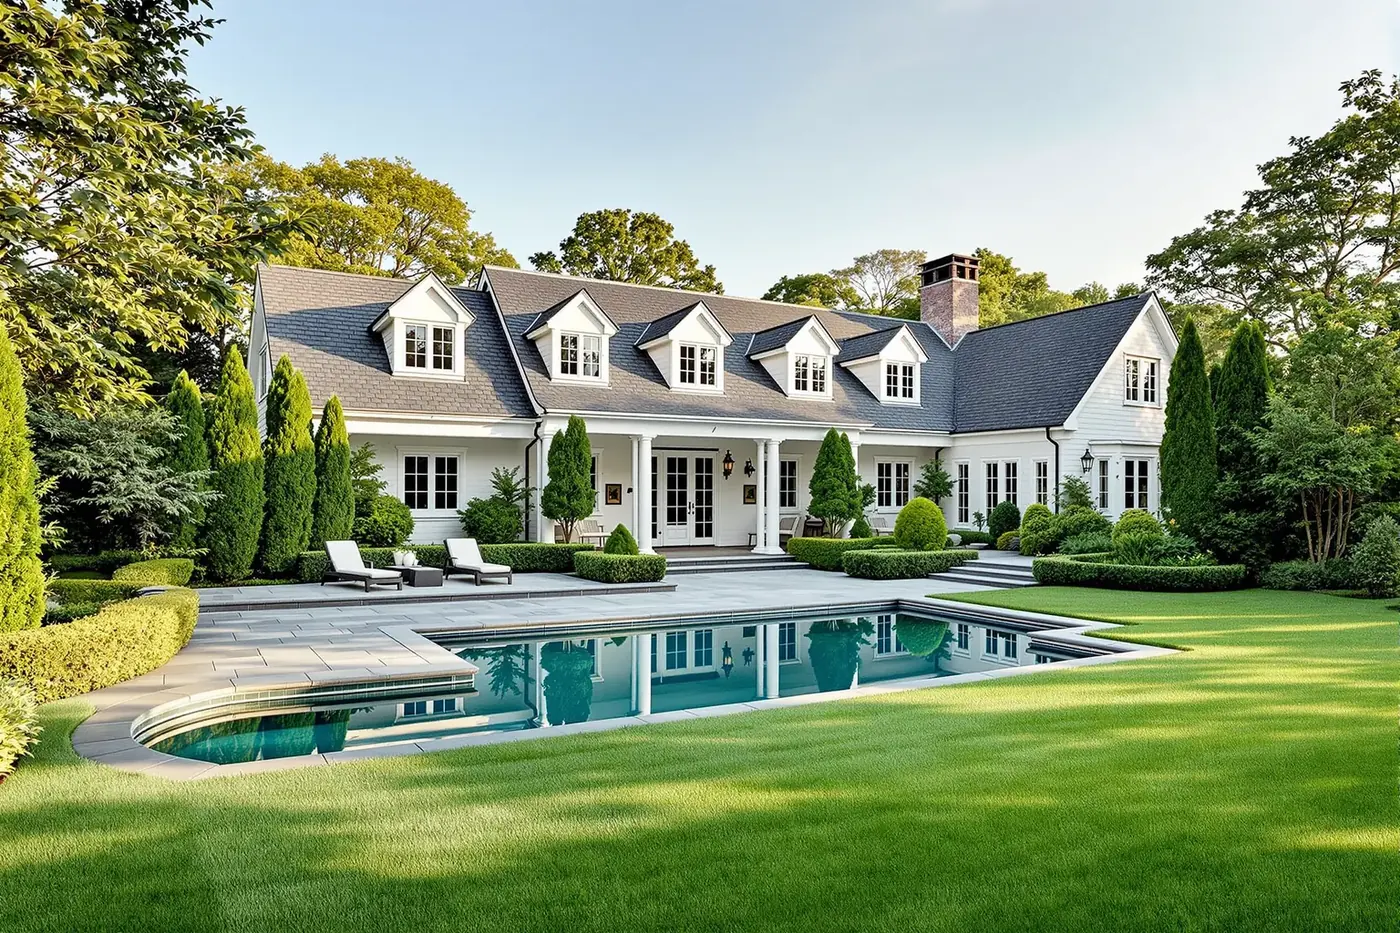
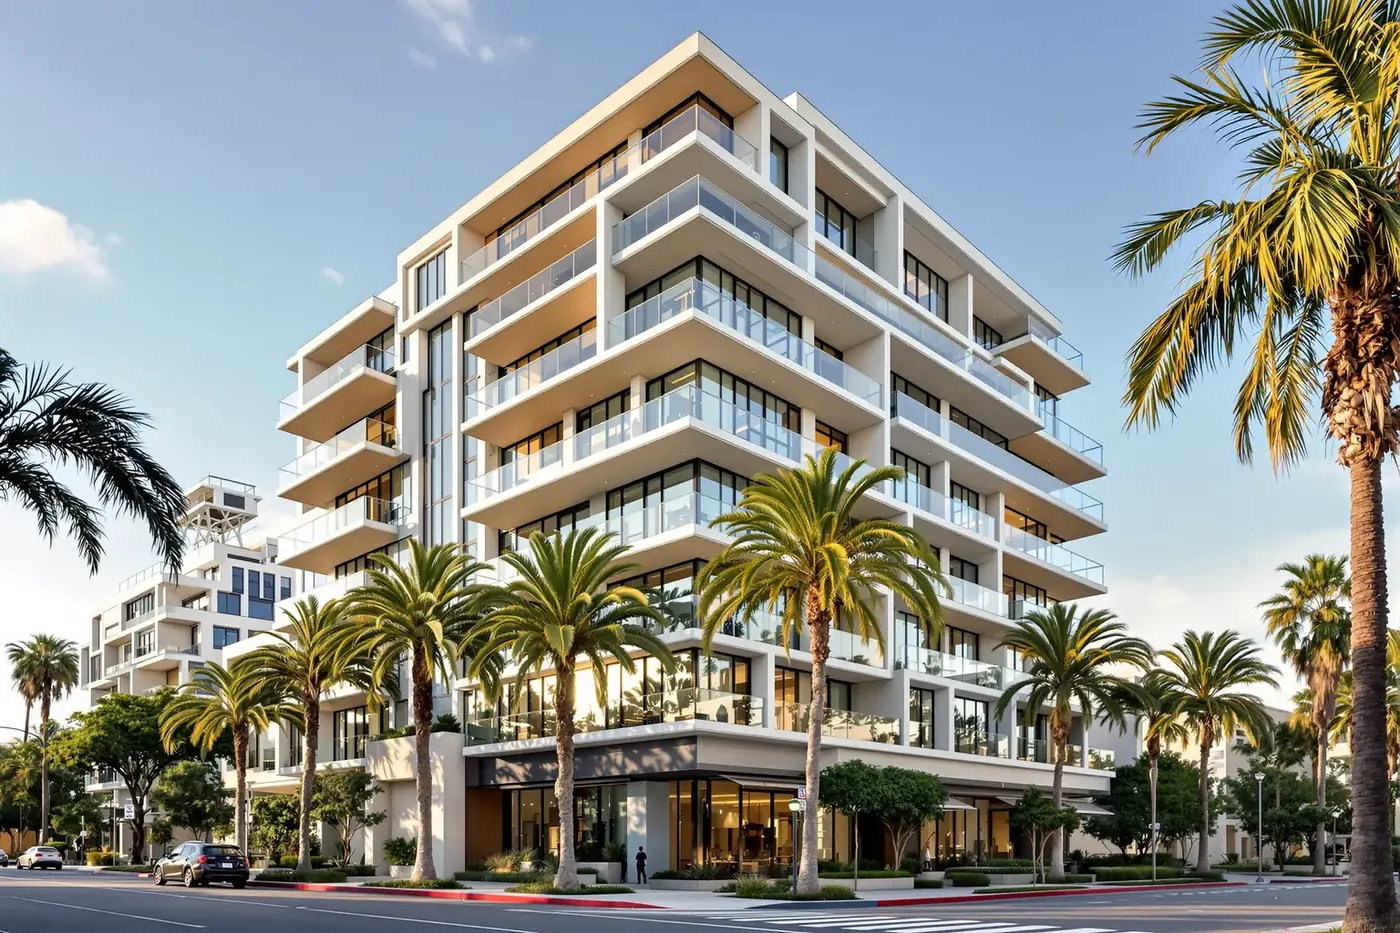
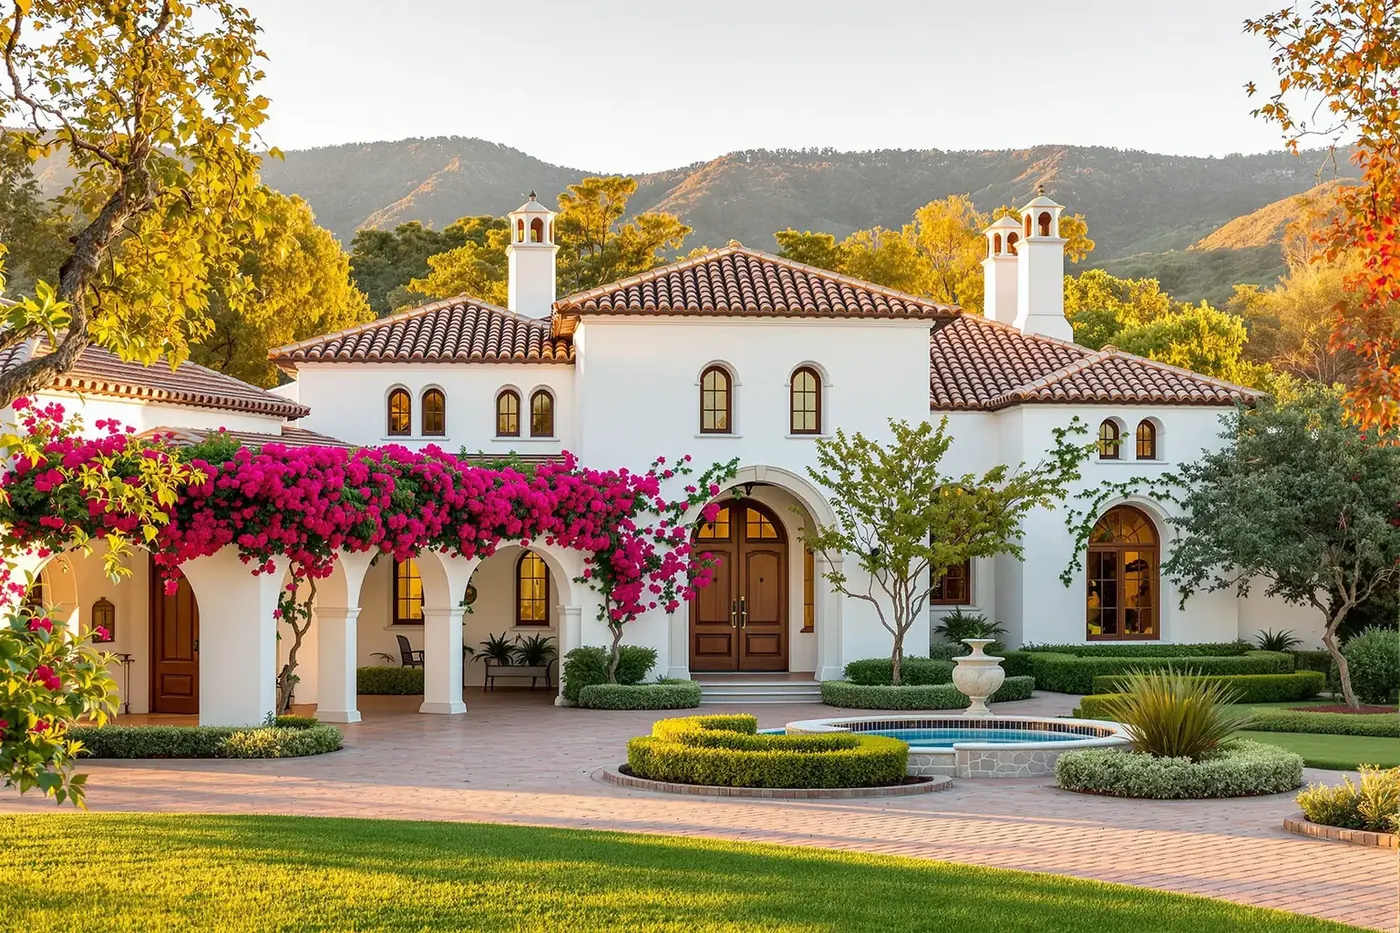
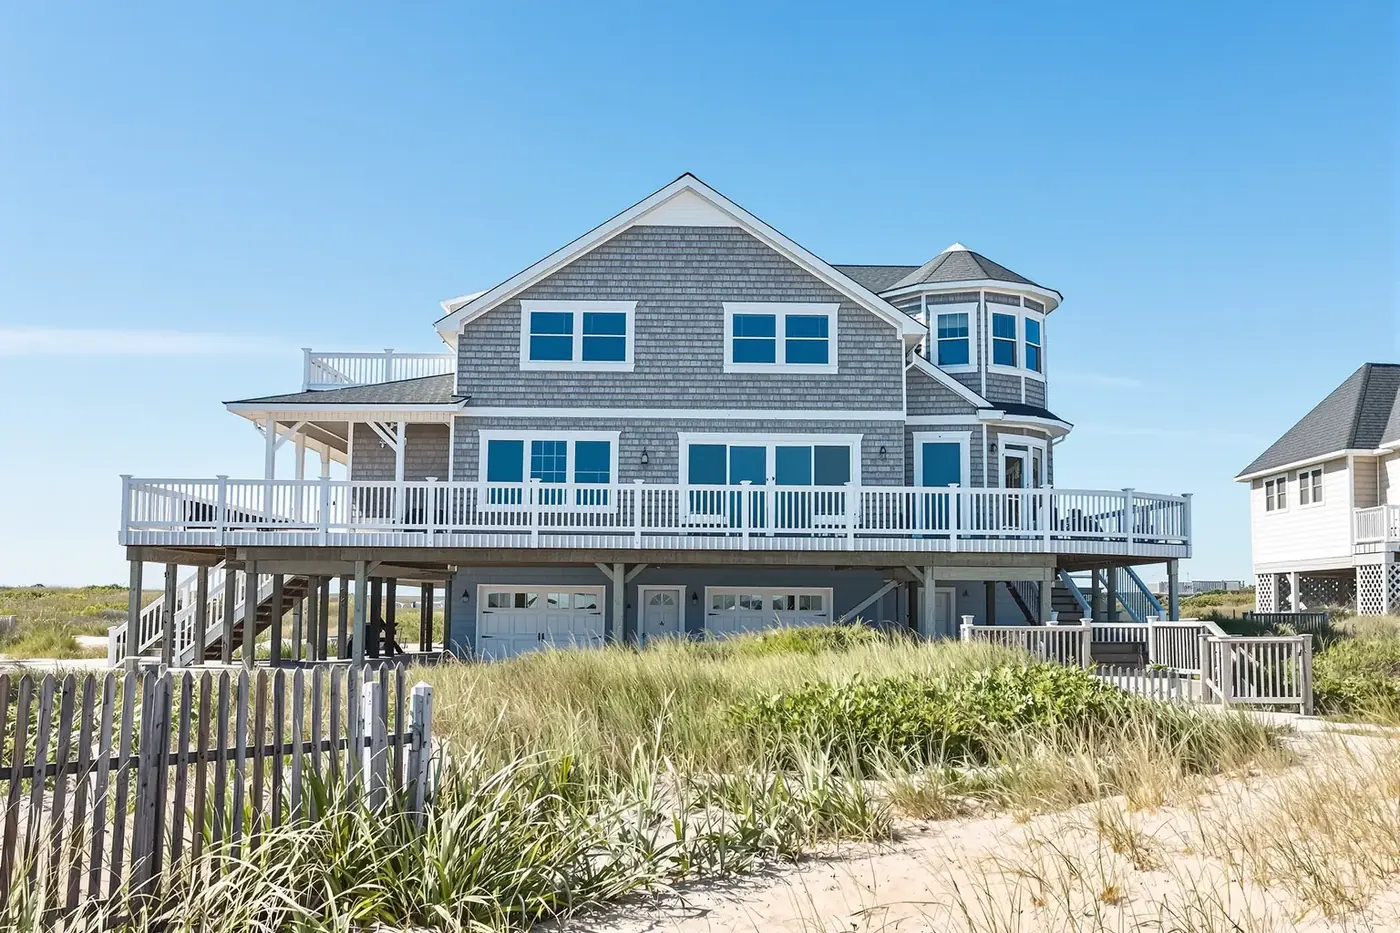
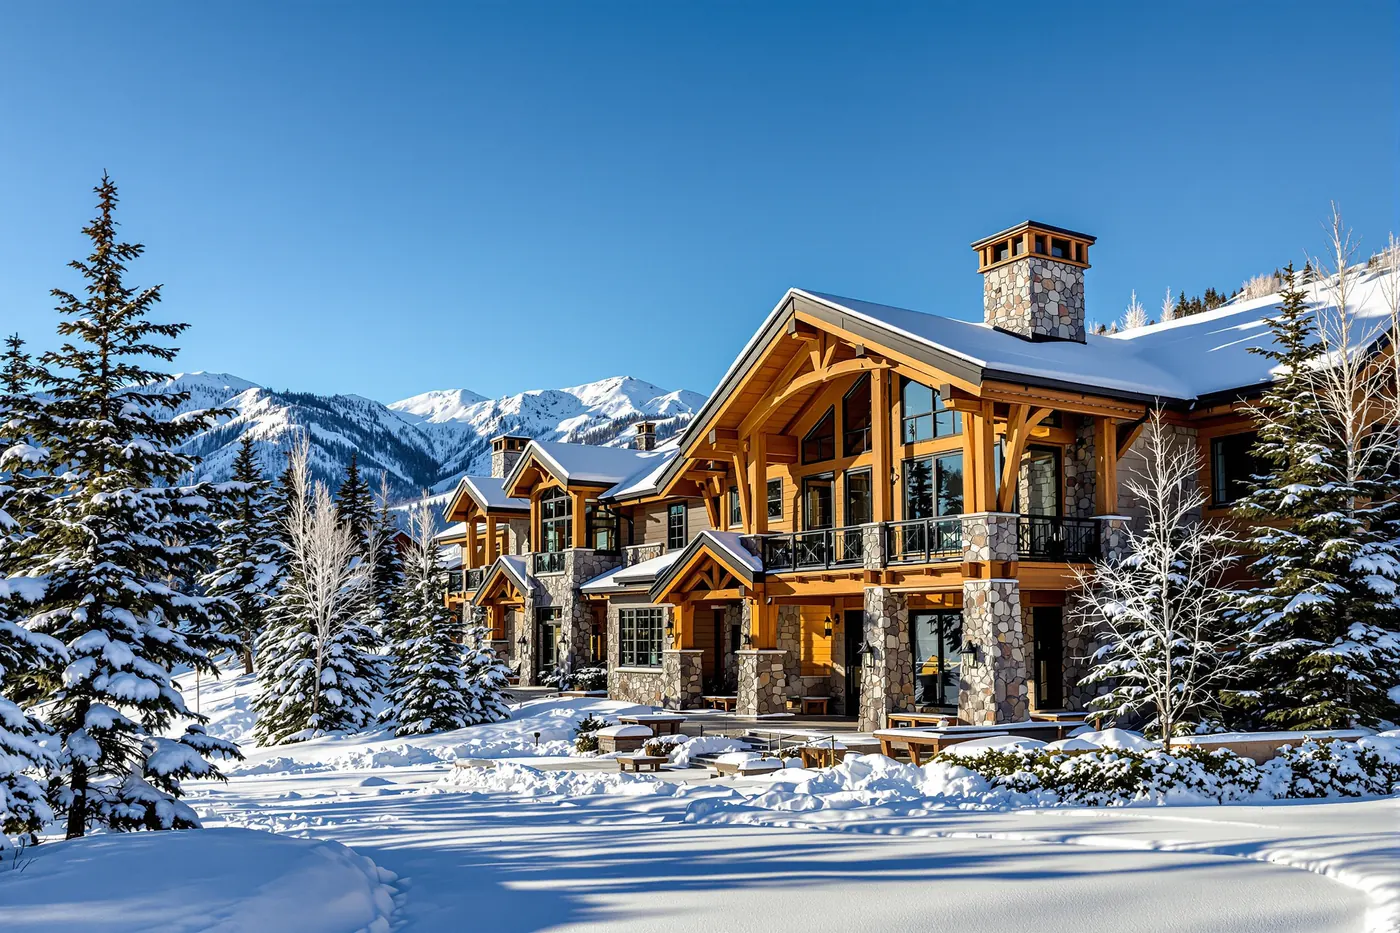
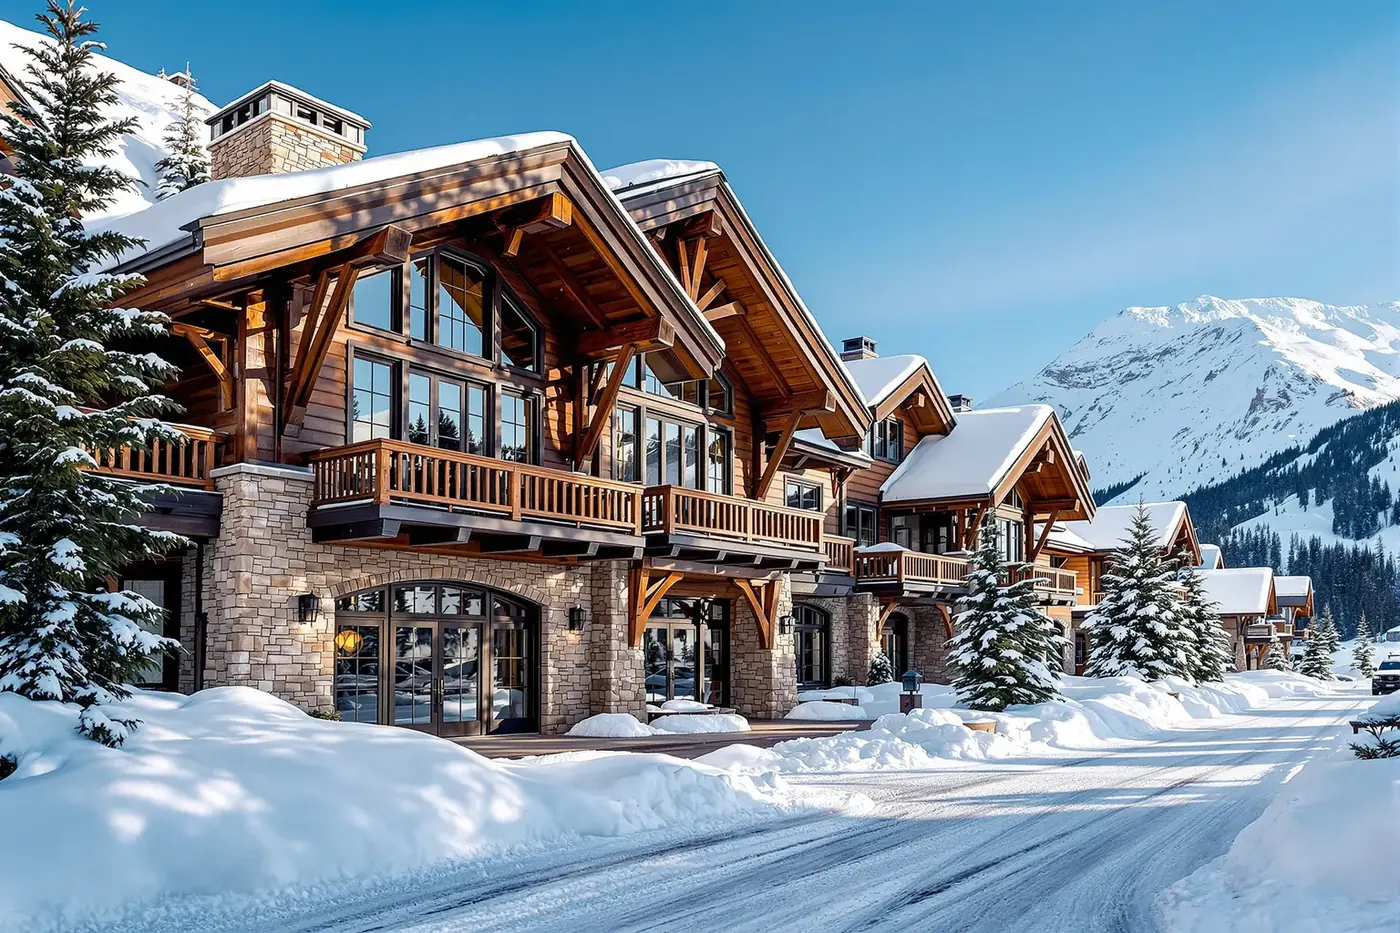
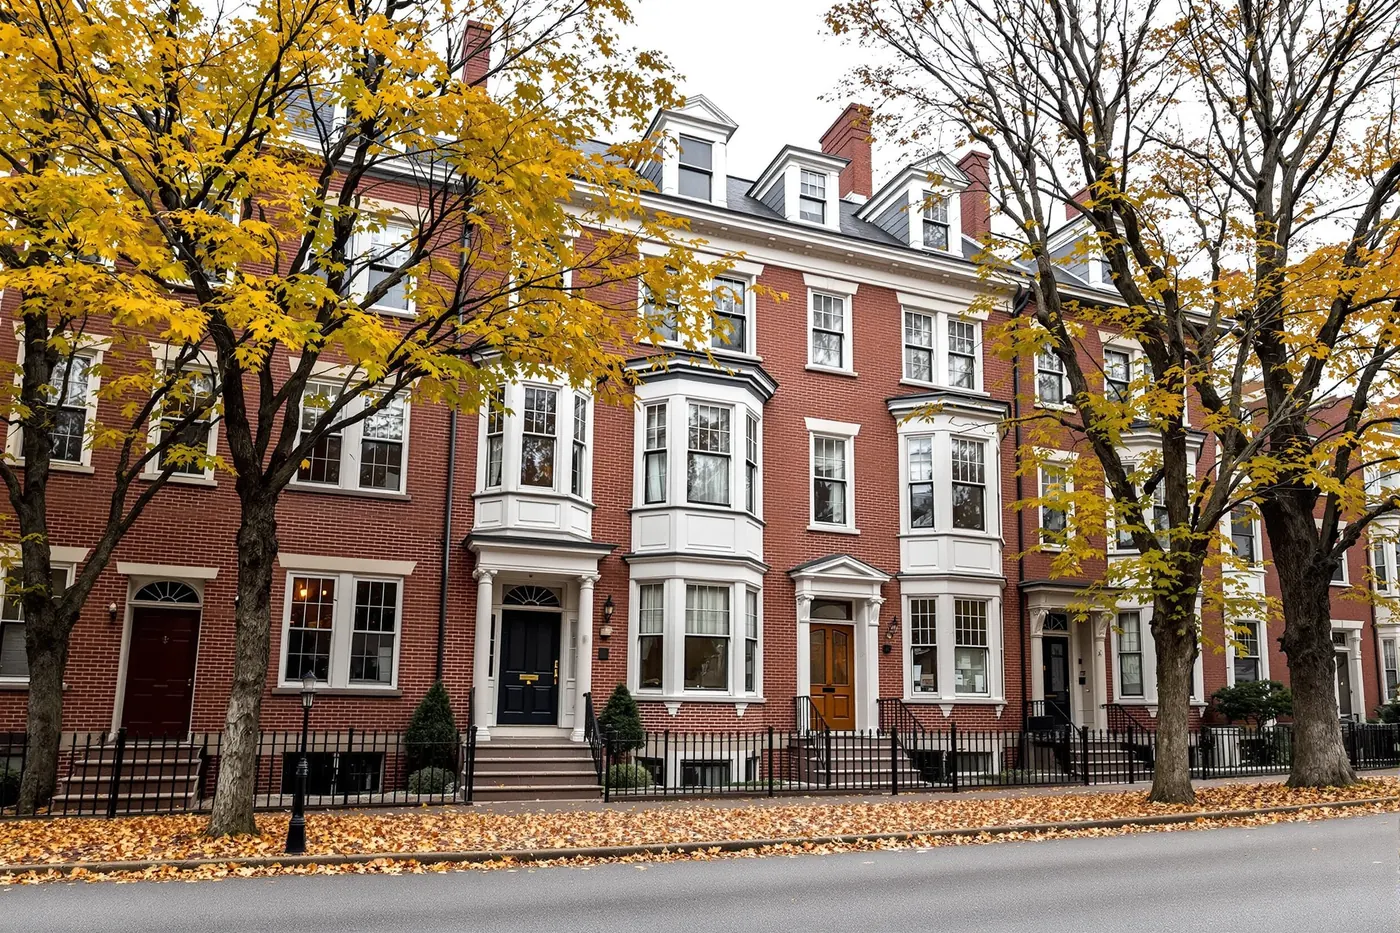
Presented in rank order. Images are illustrative renderings of each market's characteristic housing stock, not photographs of specific properties.
 1
1 Avalon, NJ Second-home
- Composite
- 0.926
- Median value
- $1,756,100
- Investor density
- 79.9%
- Long-term rental
- 0.8%
- Second-home
- 79.1%
- Housing units
- 5,427
- Owner-occupied
- 733
- Search demand
- Low
Avalon is the purest second-home market in the index, and it is not close. Of its 5,427 housing units, 79.1% are held for seasonal, recreational or occasional use, while long-term renters occupy just 0.8% — roughly 42 units in the entire borough. Only 733 units are owner-occupied as a primary residence. Combine that ownership pattern with a $1,756,100 median value and Avalon becomes a market composed almost entirely of high-basis property that somebody owns and does not live in full-time. That is the ownership profile most closely associated with cost segregation interest, though second-home ownership carries personal-use questions that a long-term rental does not, and those questions are answered property by property rather than market by market.
 2
2 Santa Monica, CA Long-term rental
- Composite
- 0.922
- Median value
- $1,810,200
- Investor density
- 64.6%
- Long-term rental
- 63.2%
- Second-home
- 1.5%
- Housing units
- 52,381
- Owner-occupied
- 13,361
- Search demand
- Moderate
Santa Monica is Avalon's mirror image, and the contrast is the most instructive pairing in the index. Here 63.2% of the 52,381 housing units are occupied by long-term renters and only 1.5% are seasonal — the second-home share is a rounding error. What Santa Monica shares with Avalon is basis: a $1,810,200 median value, the highest of any market in the index with more than 50,000 housing units. This is a large, dense, high-value long-term rental market rather than a vacation market, and it is worth noting that in coastal Los Angeles County a substantial share of that value sits in land, which is not depreciable at all.
 3
3 Nantucket, MA Second-home
- Composite
- 0.900
- Median value
- $1,387,000
- Investor density
- 66.2%
- Long-term rental
- 9.5%
- Second-home
- 56.7%
- Housing units
- 12,449
- Owner-occupied
- 3,861
- Search demand
- Low
Nantucket is one of the few markets that is genuinely both. Seasonal and occasional-use property accounts for 56.7% of its 12,449 units, but another 9.5% is long-term rental — a working year-round housing stock underneath the summer one. The $1,387,000 median value is achieved across a far larger unit count than the small shore boroughs that surround it in the ranking, which is what separates Nantucket from a market like Surf City: it has scale as well as concentration. Its 3,861 owner-occupied units also make it a real community rather than a seasonal enclave, and its search demand is the highest of any island market measured.
 4
4 Southampton, NY Second-home
- Composite
- 0.871
- Median value
- ≥ $2,000,001
- Investor density
- 60.3%
- Long-term rental
- 6.8%
- Second-home
- 53.5%
- Housing units
- 3,945
- Owner-occupied
- 1,463
- Search demand
- Low
Southampton posts a median value at or above $2,000,001, the Census top-code, meaning its true median is censored and unknown — it is one of 34 markets in the screened universe wealthy enough to hit that ceiling. Beneath it, 53.5% of the 3,945 housing units are seasonal or occasional-use and 6.8% are long-term rental. The estate-scale housing stock here means the gap between a market median and any individual property is wider than almost anywhere else in the index, which is exactly why a market ranking cannot substitute for a property-level analysis.
 5
5 West Hollywood, CA Long-term rental
- Composite
- 0.858
- Median value
- $969,900
- Investor density
- 71.7%
- Long-term rental
- 70.6%
- Second-home
- 1.1%
- Housing units
- 25,315
- Owner-occupied
- 4,608
- Search demand
- Low
West Hollywood has the highest long-term renter share of any market in the top ten: 70.6% of its 25,315 units are renter-occupied, against a seasonal share of 1.1%. Only 4,608 units are owner-occupied primary residences. The housing stock is dominated by mid-century courtyard apartment buildings and small multifamily — the property class where investor ownership is the norm rather than the exception. At a $969,900 median it is the least expensive market in the top ten, which places it unusually high on ownership structure rather than on price.
 6
6 Santa Barbara, CA Long-term rental
- Composite
- 0.851
- Median value
- $1,466,400
- Investor density
- 58.6%
- Long-term rental
- 56.5%
- Second-home
- 2.1%
- Housing units
- 39,015
- Owner-occupied
- 14,566
- Search demand
- Moderate
Santa Barbara pairs a $1,466,400 median value with a 56.5% long-term renter share across 39,015 housing units, making it one of the few markets in the index that is simultaneously high-value, large, and rental-dominated. Its seasonal share is only 2.1%, so despite its reputation as a destination, the measured housing data describes a conventional rental market rather than a second-home one. It also carries one of the two highest investor search-demand readings in the top ten, alongside Santa Monica.
 7
7 Rehoboth Beach, DE Second-home
- Composite
- 0.850
- Median value
- $1,238,400
- Investor density
- 75.1%
- Long-term rental
- 4.5%
- Second-home
- 70.5%
- Housing units
- 3,184
- Owner-occupied
- 659
- Search demand
- Minimal
Rehoboth Beach reaches seventh on ownership concentration almost alone: 70.5% of its 3,184 units are seasonal or occasional-use and just 4.5% are long-term rental, with only 659 owner-occupied primary residences in the entire city. The $1,238,400 median value is high for the Mid-Atlantic shore. Its search-demand reading is minimal, which is a useful caution about the demand factor generally — a market this small produces search volumes too low to distinguish reliably from its neighbors, and its rank rests on the two Census-measured factors.
 8
8 Park City, UT Second-home
- Composite
- 0.825
- Median value
- $1,739,700
- Investor density
- 57.6%
- Long-term rental
- 10.1%
- Second-home
- 47.5%
- Housing units
- 8,682
- Owner-occupied
- 2,400
- Search demand
- Low
Park City combines a $1,739,700 median value, the second-highest in the top ten, with 47.5% seasonal-use property and a further 10.1% long-term rental across 8,682 units. That 10.1% matters: unlike the shore markets above it, Park City retains a functioning year-round rental stock alongside its second-home inventory. Ski-market housing also tends to carry a higher improvement share of total value than coastal land-constrained markets, and since only improvements are depreciable, that distinction affects what a headline price actually represents.
 9
9 Vail, CO Second-home
- Composite
- 0.825
- Median value
- $1,040,100
- Investor density
- 65.5%
- Long-term rental
- 10.8%
- Second-home
- 54.7%
- Housing units
- 7,099
- Owner-occupied
- 1,672
- Search demand
- Minimal
Vail's 54.7% seasonal share and 10.7% long-term rental share across 7,099 units give it nearly the same ownership structure as Park City at a lower $1,040,100 median. The condominium and lodge-style stock that dominates Vail is worth noting on its own terms: for attached and fractional property types, the land component behaves differently than it does for a detached single-family home, which is one of the reasons two markets with similar medians can differ in what portion of price is depreciable at all.
 10
10 Cambridge, MA Long-term rental
- Composite
- 0.811
- Median value
- $1,040,500
- Investor density
- 62.0%
- Long-term rental
- 60.2%
- Second-home
- 1.8%
- Housing units
- 54,612
- Owner-occupied
- 16,718
- Search demand
- Low
Cambridge is the largest predominantly-rental market in the top ten by unit count after New York, with 60.2% of its 54,612 units renter-occupied and a seasonal share of 1.8%. Its $1,040,500 median value is remarkable for a market of that size and density. The characteristic stock — three-story wood-frame multifamily and brick rowhouses, much of it pre-war — is the kind of older, small-scale multifamily where ownership is heavily investor-held, and it sits alongside 16,718 owner-occupied primary residences.
Scatter plot of median home value against investor and second-home density for all 399 scored markets, with the top 50 filled and the remainder of the pool in outline.
Limitations
- This is a market index, not a property analysis. Cost segregation results are determined by an individual property's basis, components, placed-in-service date and the owner's tax posture. A market's rank says nothing about a specific building.
- Land share is not modeled. Only improvements are depreciable. Markets with identical medians can carry very different land components, and this index does not measure that. See Finding 02.
- ACS medians are estimates with margins of error, and five-year estimates describe 2019–2023 rather than today. Markets that moved sharply since then are described by older data.
- 34 markets in the scored pool hit the Census top-code of $2,000,001. For those markets the true median is censored, and they are effectively tied at the ceiling.
- Search volume is a weak, population-confounded signal and is reported as a tier rather than a figure. See Finding 03.
- The state cap shapes the published list. The unconstrained ranking is published alongside it in the downloadable data.
Citation and reuse
This dataset is released under CC BY 4.0. You may republish the rankings, tables and charts, including commercially, with attribution.
Cost Seg Smart Research Team. Cost Seg Smart Rental Property Opportunity Index 2026: The Top 50 U.S. Markets. 2026-07-20. https://costsegsmart.com/research/rental-opportunity-index-2026/
Every market guide we publish
258 location guides across 43 states. State hubs are listed first in each group.
Alabama
Arizona
California
Colorado
Connecticut
Delaware
District of Columbia
Florida
- Amelia Island
- Boca Raton
- Bradenton
- Cape Coral
- Cocoa Beach
- Coral Gables
- Delray Beach
- Destin
- Estero
- Fort Lauderdale
- Fort Myers
- Jacksonville
- Jupiter
- Key West
- Kissimmee
- Marco Island
- Miami
- Naples
- New Smyrna Beach
- Ocala
- Orlando
- Palm Beach
- Ponte Vedra Beach
- Santa Rosa Beach
- Sarasota
- St. Augustine
- St. Petersburg
- Stuart
- Tampa
- Vero Beach
- Wellington
- West Palm Beach
- Weston
- Winter Park