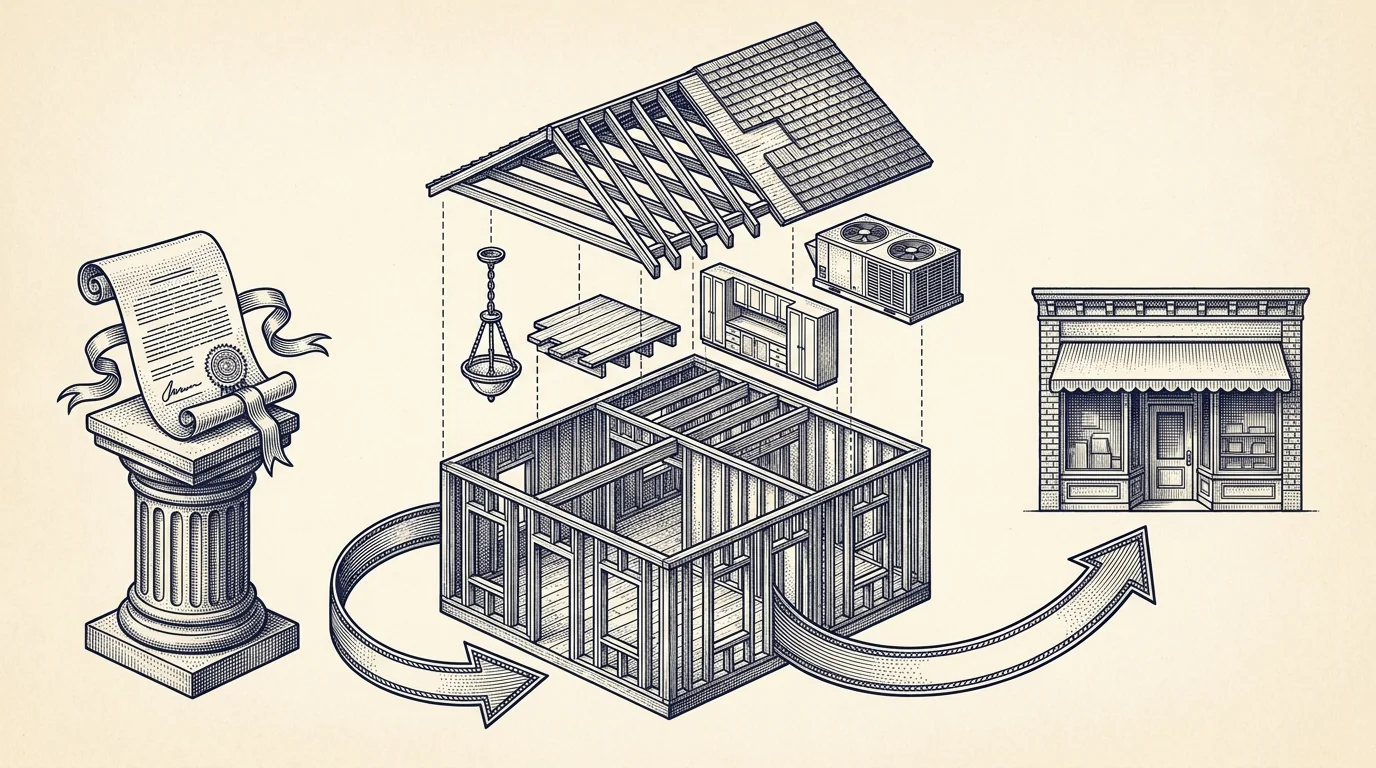
Cost segregation, explained.
Plain-English breakdowns of bonus depreciation, passive losses, REPS, the STR loophole, and the IRS rules that govern rental property tax strategy.

Fundamentals
Bonus depreciation, MACRS classes, passive activity rules — the building blocks.

10 Cost Segregation Mistakes That Trigger IRS Audits (2026)
Aggressive reclassification beyond benchmark ranges, missing component documentation, ignoring §1.263(a) capitalization rules, claiming W-2 offset without REPS or material participation, and 6 other errors that turn a valid study into an audit liability.
Read
11 Red Flags to Watch For When Picking a Cost Segregation Provider
Rule-of-thumb allocations, missing preparer attestation, percentage guarantees, no audit-support scope in writing, hidden site-visit charges, vague methodology disclosure, and 5 other warning signs that should disqualify a provider before you order.
Read
Cost Segregation $1M–$2M: Where Year-1 Federal Savings Cross $80K (2026 Benchmarks)
In the $1M–$2M price bucket, Year-1 federal savings cross $80K on residential and $130K on commercial. The decision shifts from whether to do cost seg to which provider tier — $1,395 automated vs $5,000+ traditional. Real numbers on both property types, the land-allocation math at high-cost markets, and when a site-visit engagement is genuinely worth what it costs.
Read
Cost Segregation Under $200K: When the Math Pencils (and When It Doesn't)
On a sub-$200K rental, the study fee can eat half the Year-1 benefit. Real worked example on a $150K SFR, the break-even formula, and the three scenarios where small-property cost seg still pays — Form 3115 lookback, STR FF&E density, and high-bracket investors.
Read
The Best Cost Segregation Companies (2026): An Honest Comparison
Six cost-segregation providers compared on price, speed, methodology, and best-fit property type. Madison SPECS, ETS, ELB, CSSI, Bedford, and Cost Seg Smart — same IRS ATG framework, very different fits.
Read
Is Cost Segregation Worth It on a $500K–$1M Rental?
The cleanest cost-seg ROI territory in residential real estate. $500K–$1M rentals at $895–$995 study fees produce $25K–$70K in Year-1 federal savings. Real math, three anonymized properties, and where this range doesn't work.
Read
Cheap Cost Segregation Study: What $495 Actually Gets You
A cheap cost segregation study uses the same industry-standard construction cost data and the same IRS rules as a $5,000 study. Three real $200K–$275K rentals showing 16×–40× ROI — and the cases where the math doesn't work.
Read
Augusta Rule Guide (2026)
Rent your home to your business 14 days/year, income tax-free. Three audit-proofing rules, $5K+ savings at the 32% bracket, and the documentation that holds up.
Read
Backdoor Roth IRA Guide (2026)
High earners over the $240K MFJ phaseout get $7K into a Roth tax-free in two steps — but pre-tax IRA balances trigger pro-rata. Here's how to fix it before December 31.
Read
We Built a Free Embeddable Cost Seg Calculator
Free cost segregation calculator widget for your website. One line of code. Light and dark themes. No account, no catch.
Read
Opportunity Zones Guide (2026)
Defer capital gains via QOFs, zero out the appreciation after a 10-year hold, and stack cost seg on the underlying property. Program sunsets December 31, 2028.
Read
Rental Property Depreciation: $11K/Year vs $45K+ Year 1
Same property, same IRS rules — different timing. The 27.5-year straight-line schedule vs the 5/7/15-year reclassification math, with worked numbers.
Read Is Cost Seg Worth It on a $400K Rental? $7K–$34K Yr-1 Math (2026)
Real numbers on $200K–$500K rentals: 18–27% reclass, $495–$995 study fees, $7K–$34K Yr-1 federal tax savings. Where the small-property math actually pencils.
Read
The Disadvantages of Cost Segregation
Recapture, passive loss limits, state addbacks, short holds, and 6 other tradeoffs that can sink the cost seg math. Where to skip the study entirely.
Read
MACRS Depreciation Explained
MACRS is the depreciation system every rental property uses: 5, 7, 15, 27.5, and 39-year classes. How cost segregation reshuffles them for bigger Year-1 losses.
Read
Who Is Eligible for Cost Segregation?
Legal eligibility is broad — almost any post-1986 income-producing property. The four-factor filter (basis, bracket, hold, loss usability) is what matters.
Read
Cost Segregation Components: 36-Item IRS Reclassification List (5/7/15-Year)
All 36 components the IRS allows reclassifying from 27.5/39-year structure into 5-, 7-, and 15-year MACRS classes. Confidence rating + class assignment for each.
Read
Cost Segregation on Inherited Property: §1014 Stepped-Up Basis + Form 3115
Inherited rentals reset to FMV at date of death under §1014. Cost seg accelerates depreciation against the fresh basis; Form 3115 §481(a) catches prior-year deductions.
Read
Cost Segregation for Mixed-Use Properties: How the 27.5yr + 39yr Split Works (2026)
Cost segregation for mixed-use properties splits the basis between 27.5-year residential and 39-year commercial. Worked allocations by use ratio, reclass percentages by use type, and the 80/20 dominant-use rule that flips the schedule.
Read
Primary Residence to Rental: Cost Segregation Guide
Your depreciable basis is the lower of adjusted basis or FMV at conversion — appreciation doesn't count. The rule that surprises most homeowners-turned-landlords.
Read
Bonus Depreciation by State: 10 That Decouple from §168(k) (2026)
California, NY, NJ + 7 more states decouple from federal §168(k). Federal cost seg still works in all 50 — only the state filing changes. State-by-state map.
Read
DIY Cost Segregation: Will the IRS Accept It?
Yes, you can technically self-prepare a cost seg study. The 13 ATG elements your CPA almost certainly won't sign off on, and why a $495 study undercuts DIY economics.
Read
Do You Need REPS for Cost Segregation? No — Unless You Want W-2 Offset
REPS isn't required to order or benefit. But to offset W-2 income with rental losses, you need REPS OR the STR 7-day loophole. Three paths around the gate.
Read
Does Cost Segregation Require a Site Visit? (2026)
Traditional cost seg firms require site visits. Modern providers use remote observation with satellite imagery, assessor data, and cost databases instead.
Read
Is Bonus Depreciation Permanent? OBBBA 2025 Update
OBBBA permanently restored 100% bonus for property placed in service 2025+. No phase-down, no sunset. What this means for cost seg timing and 2023-2024 holdovers.
Read
IRS Cost Segregation ATG
Examiners use Publication 5653 as their checklist. The 13 principal elements, engineering vs percentage method, and the red flags that trigger scrutiny.
Read
When NOT to Do Cost Segregation (5 Red Flags)
We sell cost seg studies. We also turn customers away. Properties under $200K, no usable losses, sub-2-year holds, and the CPA conversation nobody talks about.
Read
Cost Segregation and the 2% Rule: Does It Still Work?
The 2% rule misses tax savings — the largest piece of Year-1 return. A $500K property failing 0.7% can still net 14.6% effective return with cost seg layered in.
Read
Minimum Property Value for Cost Segregation ($150K?)
Traditional firms charge $5K-$15K, so cost seg only made sense for expensive properties. At $495, it works for properties as low as $150K.
Read
Bonus Depreciation in 2026
100% bonus is permanent under OBBBA — no phase-down, no sunset. Here's how to stack it with cost seg for $50K+ Year-1 savings on a $750K rental.
Read
Cost Segregation for New Construction: Do It Day One
Construction invoices document every component value to the dollar — combined with 100% bonus depreciation, the cleanest, most defensible cost seg setup the IRS allows.
Read
Why We Built Cost Seg Smart | Our Story
We're STR investors who got quoted $5,000 and waited 6 weeks for a study that's pattern-matching against a documented IRS rulebook. So we built our own.
Read
First-Year Rental Depreciation Guide for New Owners
Beginner guide to first-year rental depreciation. How to calculate your depreciable basis, the mid-month convention, and using cost seg for Year 1.
ReadTax strategy
REPS, material participation, repair regs, partial dispositions, 1031s.
Self-Rentals and Cost Segregation: The Loss Trap Owners Miss (2026)
If you rent a building to your own business, cost segregation can create a first-year loss you can't use — unless you plan for the self-rental rule first.
Read
Form 3115 §481(a) Catch-Up Worksheet: Calculate Missed Depreciation (2026)
Line-by-line worksheet for computing deferred depreciation on properties you didn't cost seg in prior years. Identify basis, asset class, and the §481(a) adjustment that goes on your Form 3115.
Read REPS Hour Log: Template, Test Calculator & 750-Hour Rules (2026)
Free Excel template plus a filled-in example. Five categories of qualifying hours, the more-than-half-of-personal-services trap, and how to log contemporaneously — not in April.
Read
What is the 75/55 Rule? (And Why It's Not Actually an IRS Rule)
The '75/55 rule' is informal shorthand — usually state-level transient occupancy thresholds, not a federal tax rule. Here's what people actually mean, what the codified rules are, and why the label is misleading.
Read
Passive Activity Loss Rules
By default rental losses can't touch your salary. The $25K allowance phases out at $150K AGI — and the STR exception is the high-earner workaround.
Read_16x9.webp)
Selling After Cost Segregation: Recapture Math (2026)
Even if you sell in Year 1, you're still ahead by ~6x on the study fee after recapture. Year-by-year ROI on a $750K STR plus a 1031 deferral walkthrough.
Read
Form 3115 for Cost Segregation: Step-by-Step Guide (2026)
The IRS form that catches up years of missed depreciation in one return. Section 481(a) mechanics, automatic consent, and the 5 mistakes that trigger scrutiny.
Read
What Happens If You Don't Materially Participate?
Suspended on Form 8582, not lost. The losses release at sale or when passive income shows up — but the Year 1 W-2 offset disappears. The math, with caveats.
Read
Cost Segregation If You Plan to Sell Soon: Worth It?
You deduct at 37% and recapture at 25%. That 12-point spread is permanent arbitrage. Even on a 2-3 year hold, a $600K STR nets $36K after recapture.
Read
Cost Segregation on Renovations: 50–70% Reclass + Partial Asset Disposition (2026)
Renovation studies typically reclass 50–70% of improvement cost — 2–3× higher than whole-building studies. Plus the PAD election to write off replaced components.
Read
Section 179 vs Bonus Depreciation: Real Estate Guide
Bonus depreciation has no cap and can create a net loss. Section 179 is capped at $1.22M (2025) and limited to taxable income. Where each one fits.
Read
Depreciation Recapture After Cost Segregation (2026)
You owe recapture whether you accelerate or not. After running the math on a 7-year hold, cost seg still puts most investors $58K+ ahead net of recapture.
Read What Your CPA Needs for Your Cost Seg Study
Got a cost seg study -- now what? A practical guide to working with your CPA on Form 4562, Form 3115, bonus depreciation, and state tax implications.
Read
Cost Segregation After a 1031 Exchange
Yes, you can — but excess basis vs. carryover basis splits the math. The 'swap till you drop' playbook + a $500K excess-basis worked example.
Read
Lookback Study: Claim Missed Depreciation (Form 3115)
Never did a cost seg study? A lookback study with Form 3115 lets you catch up on missed accelerated depreciation in a single tax year.
Read
Cost Seg vs Standard Depreciation: $50K Difference
Side-by-side on a $750K rental: $21K straight-line vs $195K Year-1 with cost seg. The 5-year cash gap funds another down payment.
Read
5 Tax Mistakes Rental Investors Make (+ Fixes)
Each of these five mistakes commonly costs $10K-$50K per property per year — straight-line defaults, missed lookbacks, bonus depreciation left on the table.
ReadProperty types
STR, SFR, multifamily, commercial — what changes by property type.

Cost Segregation for Auto Dealerships: 2026 Guide with Real Numbers
A dealership stacks two of the biggest reclass levers in real estate: a massive paved display lot (15-year land) and heavy service/body-shop equipment (5/7-year). An $8M franchise store: ~$692K Year-1 federal savings on the building + lot, or over $1M with a documented equipment schedule.
Read
Gas Station Cost Segregation: Fuel Equipment, Canopies, and the 15-Year Building Rule
A gas station is one of the most equipment-dense properties an investor can own. Dispensers, tanks, the canopy, and acres of forecourt paving all depreciate far faster than the c-store shell, and a qualifying station may depreciate the entire building over 15 years. Here is how the numbers work, what qualifies, and the special rule that sets fuel retail apart.
Read
Cost Segregation for Medical & Dental Offices: 2026 Guide
A medical or dental office is a clinical fit-out wrapped in a building: exam casework, medical-gas piping, imaging power, and specialty plumbing are 5-year property, not shell. A $1.5M practice reclassifies ~$379K (≈31%), about $145,000 in Year-1 federal tax savings.
Read
Cost Segregation for Office Buildings: 2026 Guide with Real Numbers
An office is the most building-heavy commercial type, so the reclass is modest — but the tenant systems, low-voltage cabling, and parking are still real money. A $1.8M office reclassifies ~$253K (≈18.5%), about $99,000 in Year-1 federal tax savings.
Read
Cost Segregation for Restaurants: 2026 Guide with Real Numbers
A restaurant is the densest commercial property type for cost segregation: the kitchen, bar, and decorative front-of-house are personal property, not building. A $900K full-service restaurant reclassifies about $310K (≈43%) of its basis — roughly $117,000 in Year-1 federal tax savings.
Read
Cost Segregation for Retail Stores & Strip Centers: 2026 Guide
Retail stacks two reclass levers: a merchandising interior (display fixtures, track lighting, cash wraps) that's 5-year property, and a heavy customer parking lot that's 15-year land. A $1.2M store reclassifies ~$282K (≈28%), about $108,000 in Year-1 federal tax savings.
Read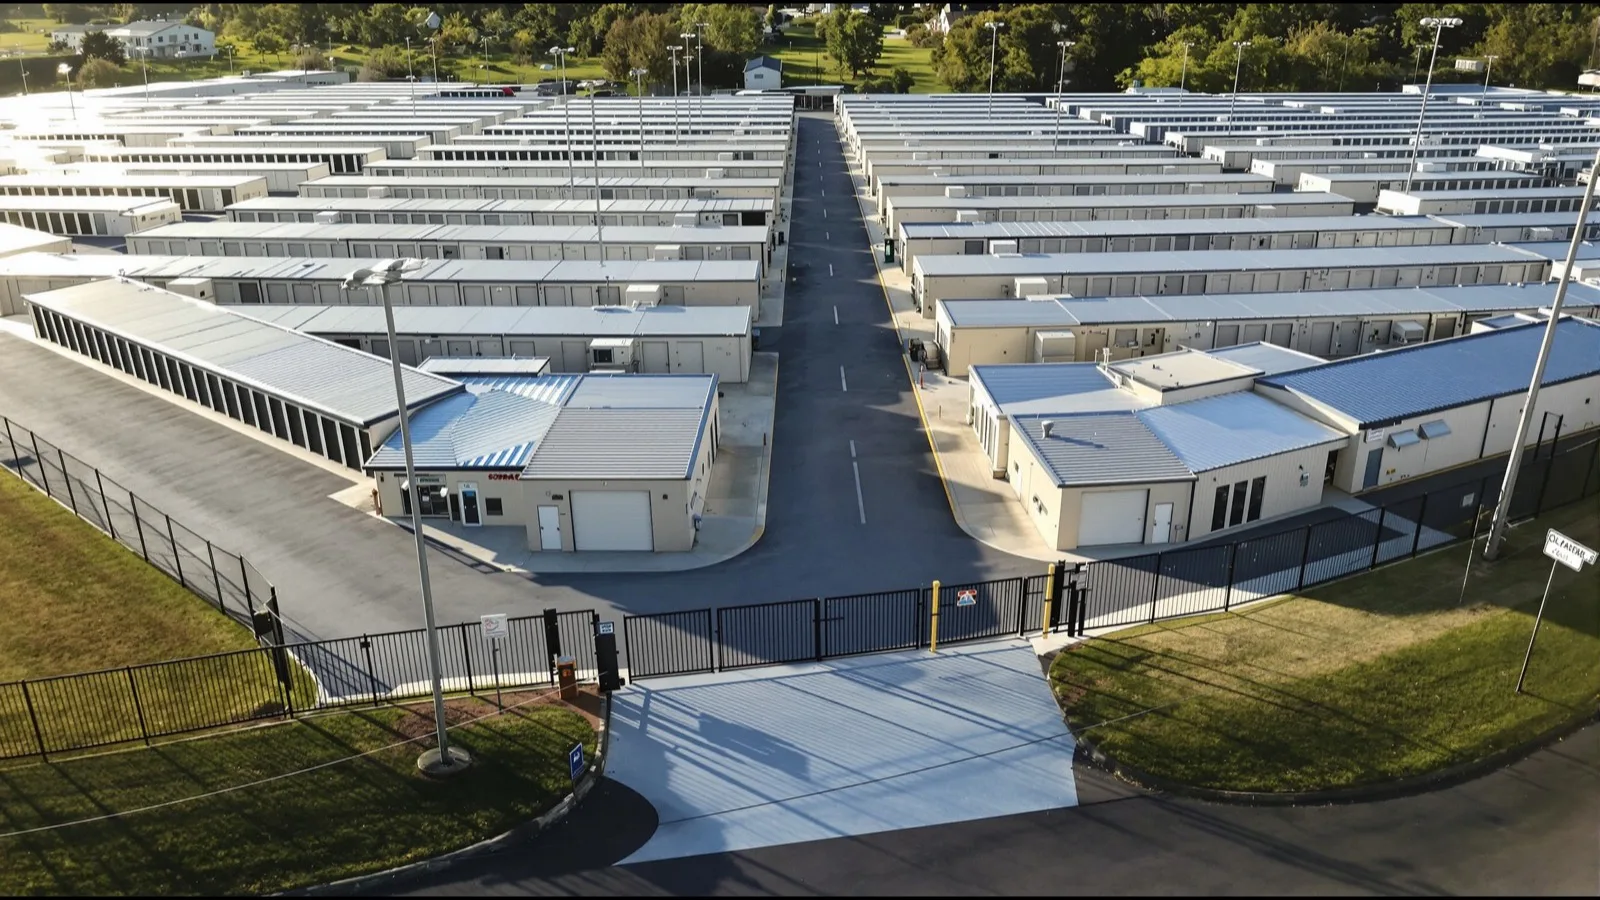
Cost Segregation for Self-Storage Facilities: 2026 Guide
A self-storage facility is a cheap shell on heavy site work: the paved drive aisles, fencing, and hundreds of roll-up doors reclassify out of the 39-year schedule. A $3M drive-up facility reclassifies ~$561K (≈23%), about $225,000 in Year-1 federal tax savings.
Read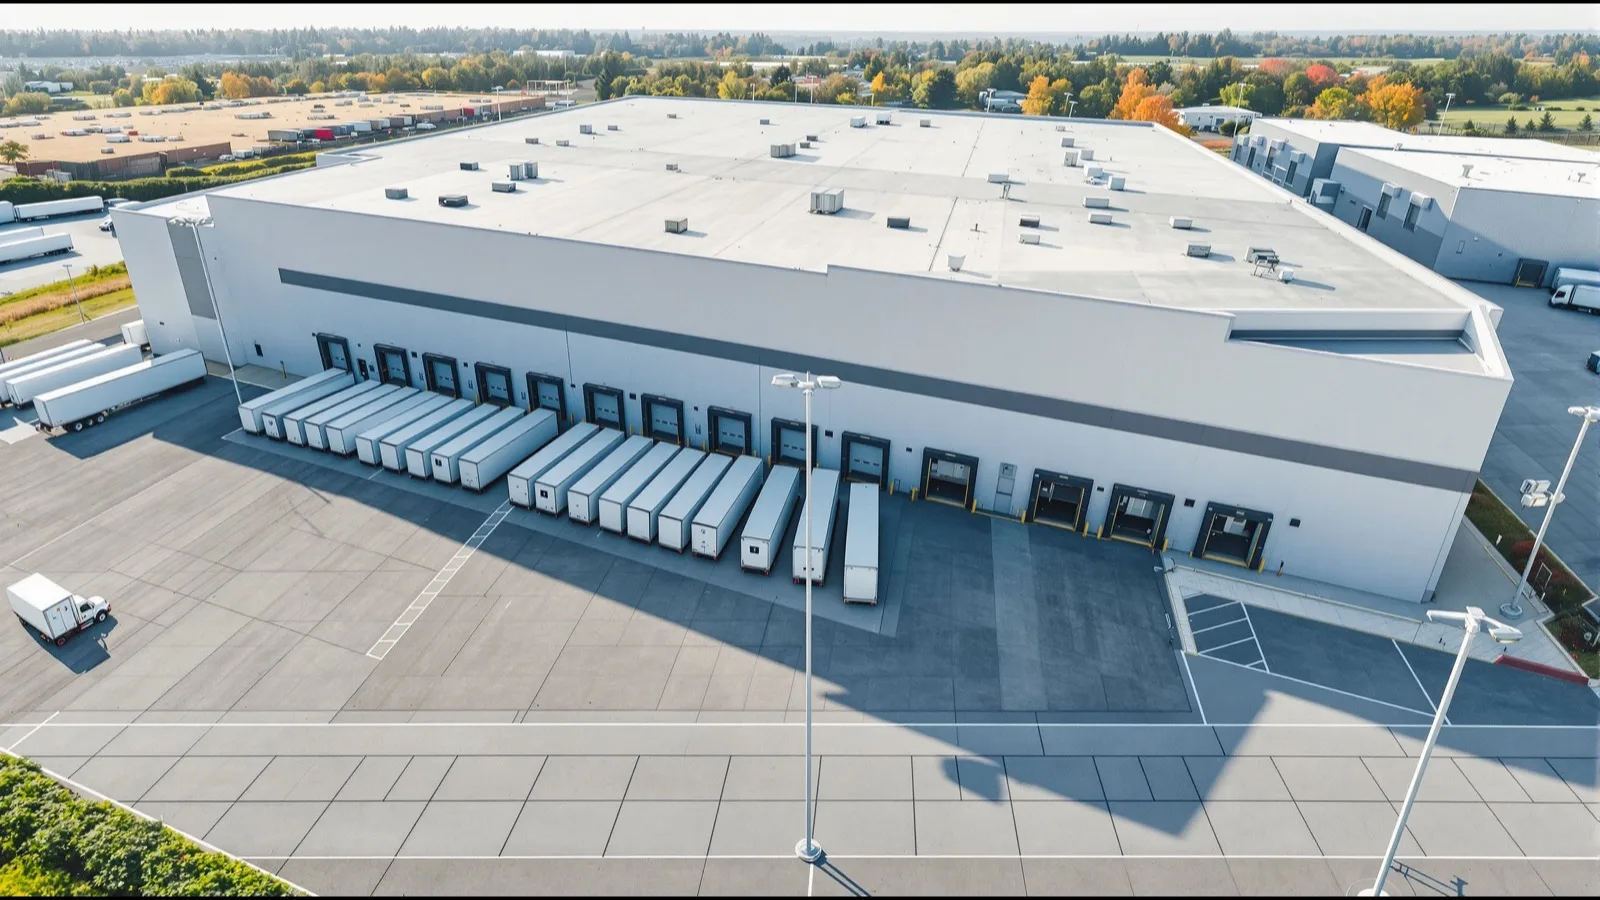
Cost Segregation for Warehouses & Distribution Centers: 2026 Guide
A warehouse is mostly 39-year shell — until you look at the lot. The truck court, trailer parking, and yard scale with site area, not building size, so a big lot is the whole story. A $6.4M distribution center on a 3× lot reclassifies ~$1.2M (≈23%), about $465,000 in Year-1 federal tax savings.
Read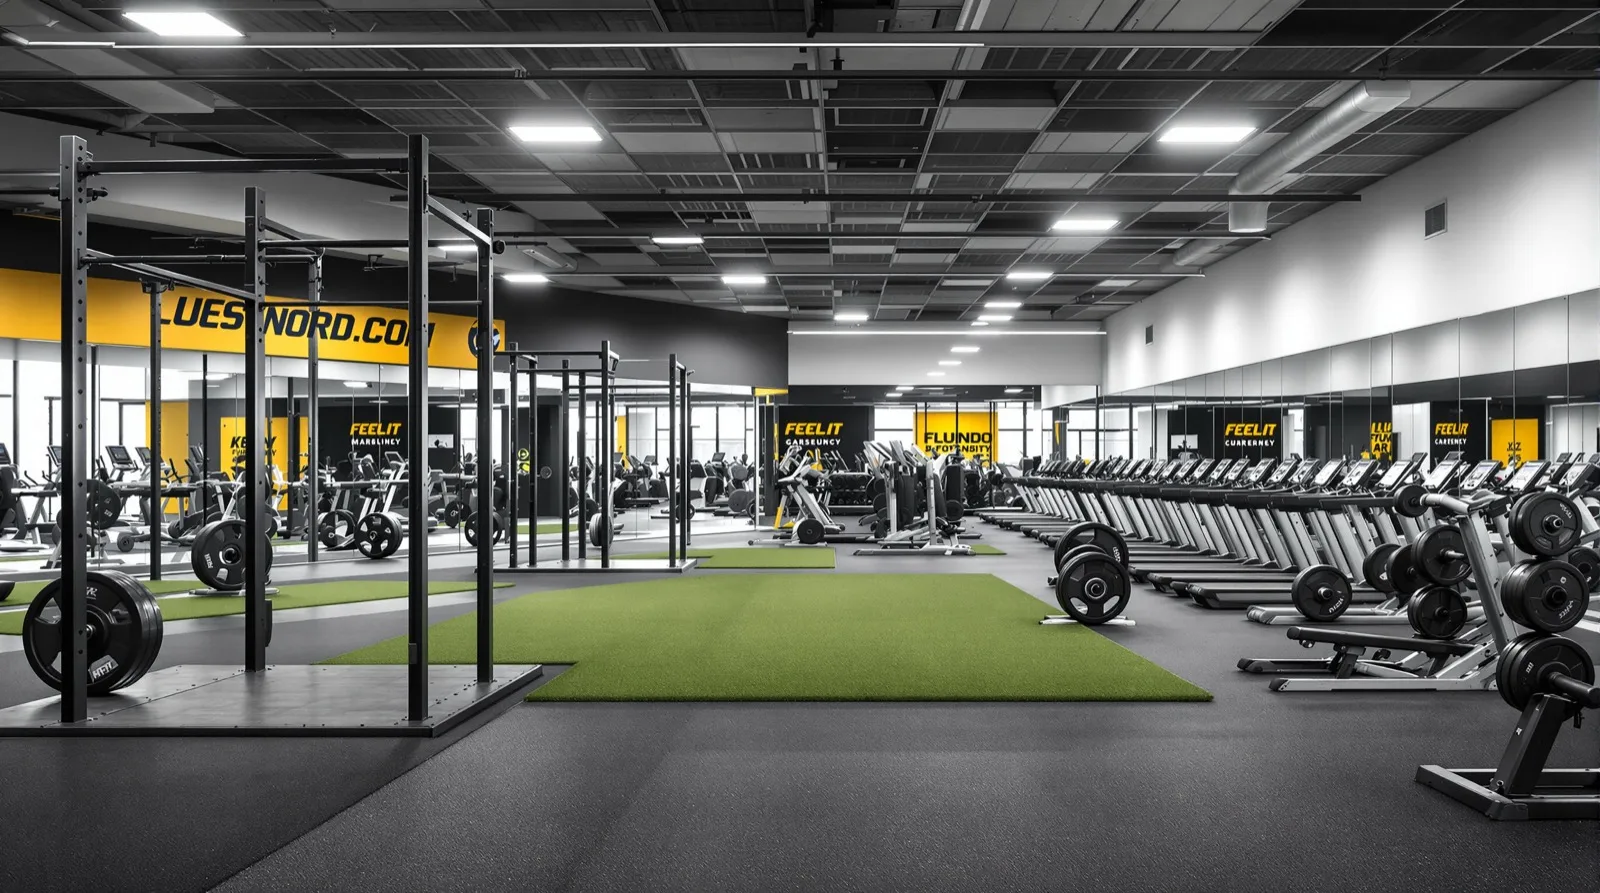
Cost Segregation for Gyms & Fitness Centers: 2026 Guide with Real Numbers
A gym is an inventory problem, not a building problem. Equipment, rubber flooring, and mirrors drive 5/7/15-year reclassification. A $2.5M gym: ~$143K Year-1 federal savings on the building alone — or ~$250K with a documented equipment schedule.
Read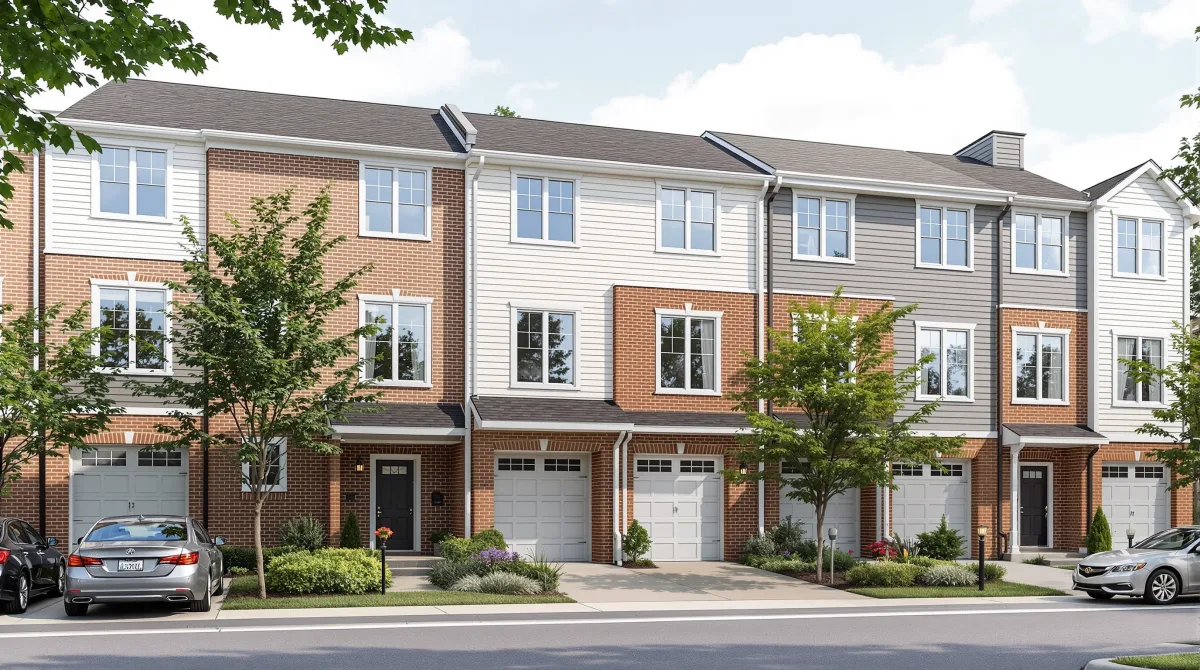
Cost Segregation for Townhomes (and Townhome STRs): 2026 Guide
A townhome owns its building and lot — so it reclassifies like a single-family home, ~13–22% of basis, not like a condo. Run it as a furnished short-term rental and the FF&E stack pushes it to ~22–32%. Here's the breakdown, with real numbers.
Read
Cost Segregation for Veterinary Clinics: 2026 Guide with Real Numbers
Veterinary clinics reclassify 22–28% of building basis into 5/7/15-year property — kennels, surgical O2, imaging power, exam casework. A $1.2M animal hospital: ~$75K Year-1 federal savings, or ~$136K with documented clinical equipment.
Read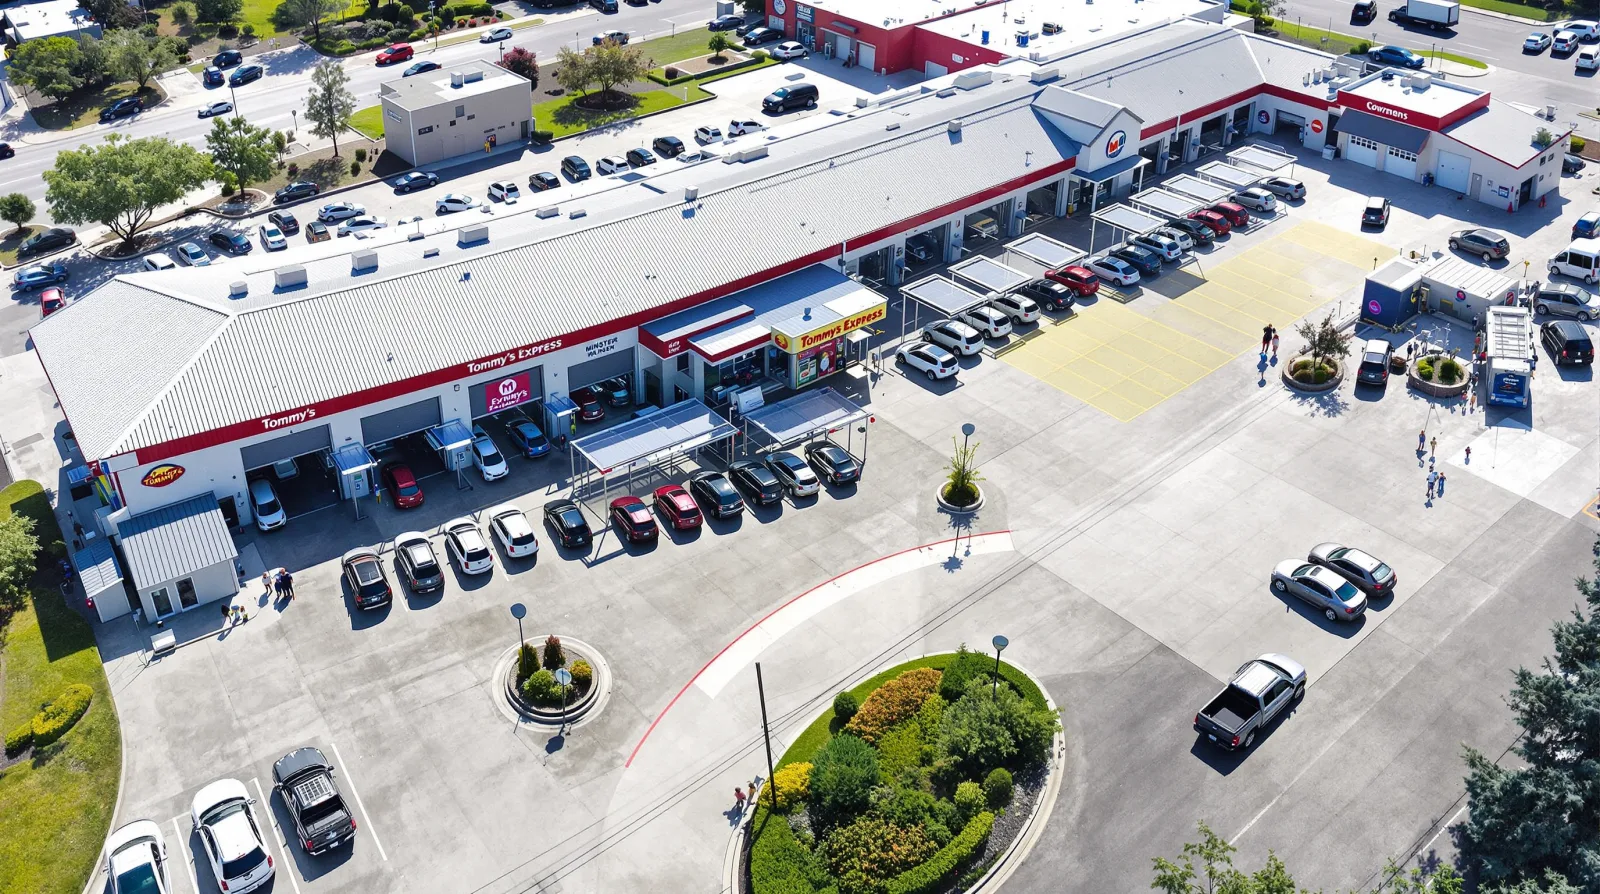
Express Tunnel vs In-Bay vs Self-Serve: How Each Car Wash Type Depreciates
Two car washes with the same square footage can differ by hundreds of thousands of dollars in depreciable equipment. Here's why car-wash cost seg is driven by configuration — tunnel length, vacuum count, reclaim — not building size, and how each format breaks down.
Read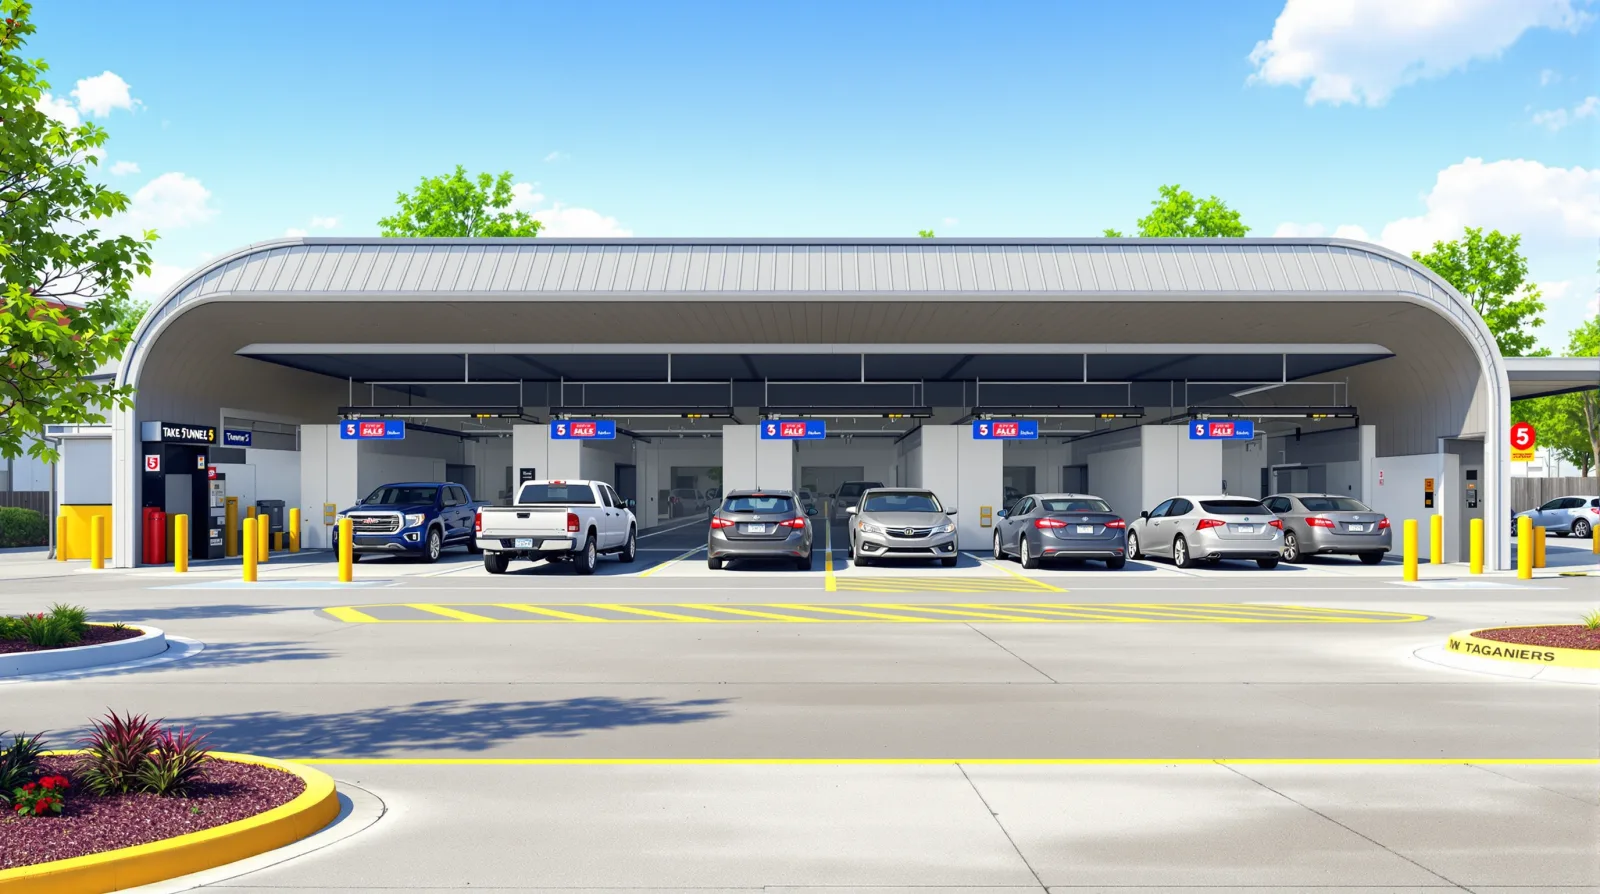
Car Wash Cost Segregation: The Highest-Acceleration Real Estate You Can Buy
A car wash is mostly equipment and pavement wrapped around a thin building shell — which is exactly why cost segregation reclassifies far more of the basis than almost any other property type. Here's how the numbers work, what qualifies, and what documentation drives the biggest deductions.
Read
Two Completely Different Cost Seg Studies: Building Owners vs Tenants
"NNN cost segregation" means one thing if you own the building and a completely different thing if you lease it and paid for the build-out. Here's how to tell which study you actually need — and why a tenant build-out reclassifies far more than an owner's purchase.
Read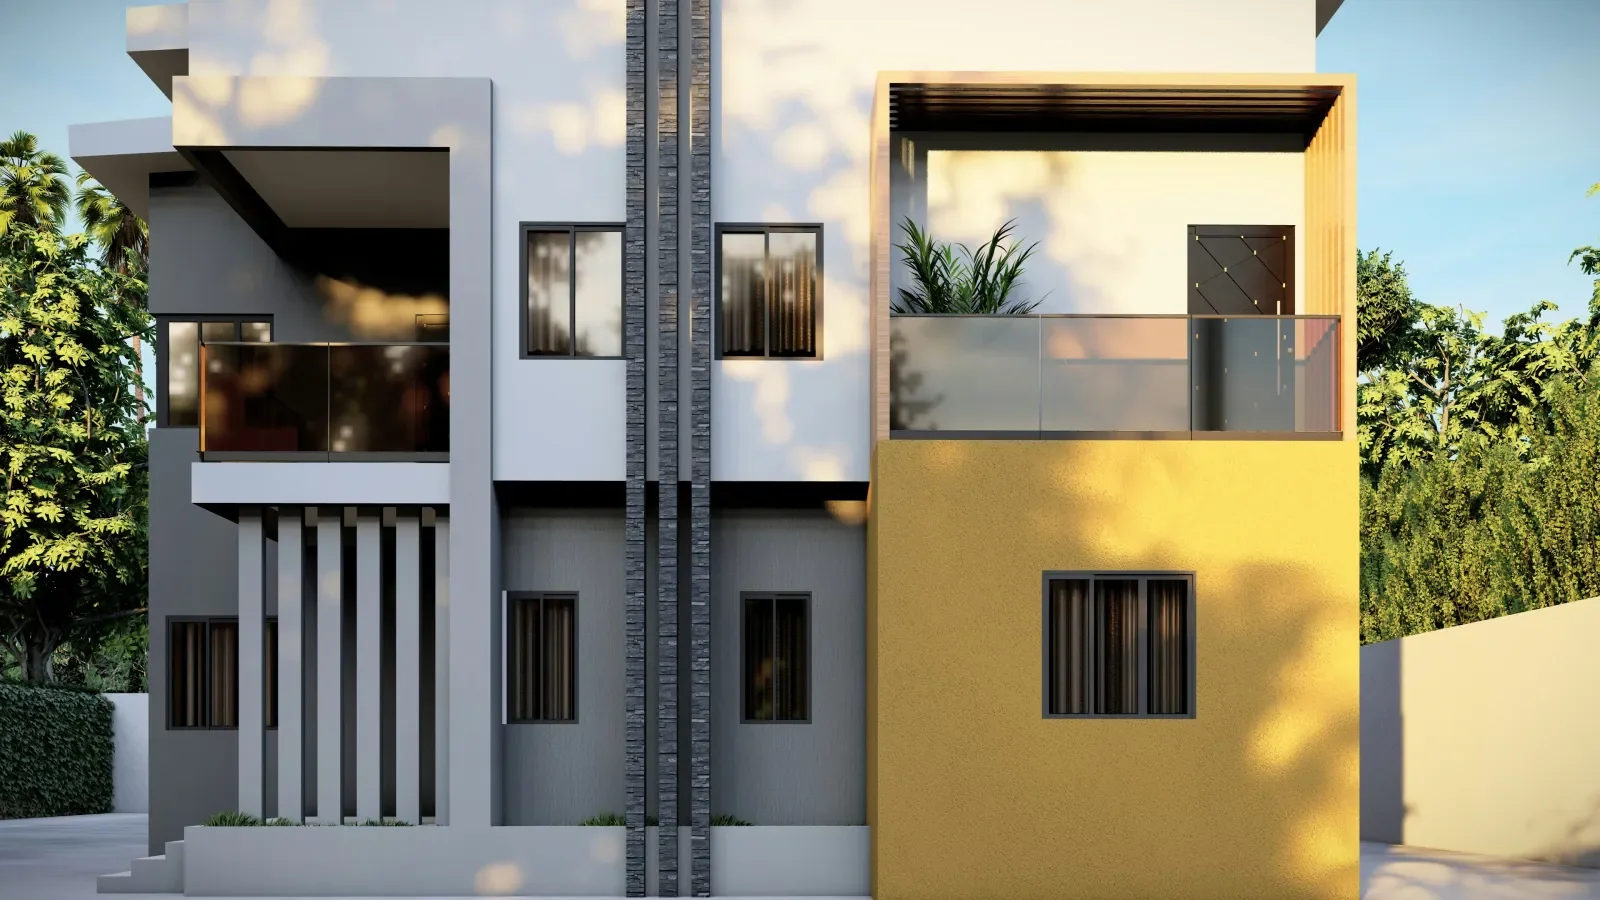
Cost Segregation on a Duplex: 20% Median Reclassification (412-Study Benchmark)
Duplexes reclassify a median 20.0% of depreciable basis (IQR 19.2–21.1%, n=20 studies). On a $400K duplex that's roughly $24K–$30K in Year-1 federal deductions after the 20% land carve-out. Same 27.5-year residential schedule as a single-family — two kitchens, two HVACs, and the per-unit FF&E multiplier are why duplex beats SFR by ~2 percentage points.
Read
Cost Segregation on a Triplex: 19.1% Median Reclassification (412-Study Benchmark)
Triplexes reclassify a median 19.1% of depreciable basis (IQR 18.5–19.7%, n=20 studies). On a $600K triplex that's roughly $91,700 in Year-1 federal deductions after the 20% land carve-out. Same 27.5-year residential schedule as a duplex — three kitchens, three HVACs, and the per-unit FF&E multiplier explain why triplex sits between duplex and fourplex.
Read
Airbnb Cost Segregation: 2026 Guide with Real Numbers
STR owners reclassify 25-35% of basis into 5-year FF&E vs. 15-22% for unfurnished rentals. Joshua Tree case: $650K Airbnb, $59K Year-1 federal savings.
Read
ADU Cost Segregation: 18–25% Reclass + Detached vs Attached Rules (2026)
Compact ADU footprints concentrate kitchens and baths into 18–25% reclass. Detached vs attached tax treatment + STR 7-day loophole. Studies from $495.
Read
Why STRs Reclassify 25–35% vs 15–22% on LTRs
Furnished STRs stack 5-year FF&E on top of standard MACRS — plus heavier 15-year site improvements. The 10-percentage-point gap, broken down by class.
Read
Material Participation for STR Owners: The 7 IRS Tests (2026 Guide)
Material participation is what unlocks non-passive STR losses against W-2 income. The 7 IRS tests under Treas. Reg. §1.469-5T, what counts as an hour, and how to document it audit-proof.
Read
STR Tax Rules: The 7-Day Loophole That Lets Airbnbs Offset W-2 Income
Three IRS rules decide whether STR losses offset W-2 wages: the 7-day average use rule (Treas. Reg. §1.469-1T), the 14-day Augusta rule (§280A(g)), and material participation. Codified law, not BiggerPockets folklore.
Read
First-Time Airbnb Owner? The Cost Seg Playbook
Most CPAs don't mention the 100-hour rule until March — when last year's hours can't be reconstructed. The Day 1 playbook for first-year STR owners.
Read STR Material Participation Log: Template, Example & 100-Hour Test (2026)
Free Excel template plus a filled-in example log. Seven activity categories, the contractor-hour trap, and how to document the 100-hour test contemporaneously — not in April.
Read
Short Term Rental Tax Loophole: 7-Day Rule Explained (2026)
The 7-day average rule under IRC §469(j)(10) lets STR owners offset W-2 income without REPS. Two-part test, $750K Airbnb math, and what disqualifies you.
Read
Multifamily Cost Segregation Guide: 20-30% Reclass, Duplex to 100+ Units
Multifamily properties typically reclassify 20-30% of building value through cost segregation. Real examples from duplex to 100+ unit apartment complex studies.
Read
Can Cost Segregation Offset W-2 Income? STR Loophole + $138K Example
Can cost segregation offset W-2 income? Yes — via the STR loophole (7-day average stay + material participation). The math: a $138K STR paper loss against $250K W-2 salary, fully deductible. The 469 rules, the audit gate, and a worked example.
Read
7 STR Tax Deductions Most Airbnb Owners Miss
Most Airbnb owners leave $40K-$100K in tax deductions on the table. Here are the 7 most commonly missed STR deductions and the math behind each one.
Read
Commercial Cost Segregation
39-year depreciation makes commercial cost seg even more valuable than residential. $2M building = ~$95K Year-1 savings. Property-type breakdowns + tenant improvement rules.
Read House Hacker's Duplex: $15K–$40K in Year-1 Tax Savings
A duplex you live in qualifies for cost seg on the rental half. Real numbers on a $400K owner-occupied duplex: study cost, Year-1 deductions, §469(i) rules.
ReadProcess & compliance
Audit defense, what documents to keep, how long a study takes.
Cost Segregation Percentages by Property Type (What to Expect)
How much of a property actually reclassifies into faster depreciation? Observed ranges by type: STR 24 to 35 percent, SFR 16 to 22 percent, multifamily 18 to 28 percent, commercial 12 to 25 percent. See where yours likely lands, plus the Year-1 deduction math.
Read
What's Inside a Cost Segregation Report?
A real $425K Charlotte SFR report dissected page by page — what your CPA actually files from, what the IRS examiner checks first, and how to spot a sloppy study.
Read
How to Reduce or Defer Depreciation Recapture
Depreciation recapture often applies but the impact can be deferred or offset. Five strategies: 1031, step-up, installment sale, passive offset, holding.
Read
Why Traditional Cost Seg Firms Charge $10,000
Roughly half the fee is overhead — site visits, sales commissions, scheduling queues. The honest breakdown of what $10,000 buys, and when it's worth paying.
Read
How Cost Segregation Shows Up on Your Tax Return
Step-by-step breakdown of how a cost seg study flows through Schedule E, Form 4562, and Form 3115. No jargon, real examples.
Read Does Cost Segregation Trigger an IRS Audit?
No, cost segregation is an IRS-recognized strategy with its own 120-page Audit Techniques Guide. What the ATG actually says, and what auditors look for.
Read
Why Some Cost Seg Studies Take 6 Weeks
Traditional firms send an engineer on-site and build manually — 4–8 weeks. Automated providers use satellite imagery and assessor data — under an hour. Why.
Read
How Much Does a Cost Segregation Study Cost? ($3,200 Median)
Median $3,200 across 2,314 quotes from 147 providers. Studies range $495–$25,000+ for the same methodology aligned with IRS guidance, only the delivery model varies. Full pricing map by property type, with the 30× spread explained.
Read
Documents for a Cost Seg Study: What You Need
Six basics — purchase price, closing date, address, year built, property type, renovations. No blueprints, no site visit, about 5 minutes from memory.
Read
How to Choose a Cost Segregation Company (2026)
Four factors that matter — IRS methodology, component-level detail, CPA compatibility, transparent pricing — plus 3 red flags (percentage-fee billing, no sample report).
ReadCase studies & examples
Real properties, real numbers, real depreciation outcomes.

Cost Segregation Reclassification Percentages: 2026 Benchmarks
Real reclassification ranges from engineering studies — not marketing spin. SFR 17-18%, STR 30-34%, restaurant 33-35%, with the drivers behind each number.
Read
Cost Segregation ROI: 10-20x Returns by Property Type
A $895 study commonly returns $26K-$95K in Year 1 tax savings. Walk-throughs of three real properties — SFR, furnished STR, $2M commercial — with the math.
ReadBy location
City-specific cost-seg breakdowns. For state hubs and full city pages, see /cost-segregation/.

Cost Segregation in Atlanta, GA: $18K-$42K Year 1
Microsoft, Google, Visa relocations push metro past 6M residents. Investor SFRs $275K-$600K hit the cost seg sweet spot. GA conforms to federal bonus depreciation.
Read
Cost Segregation in Boise, ID: $18K-$40K Year 1
Treasure Valley's 2020-2022 surge locked Meridian and Eagle investors at elevated bases. Idaho's 5.7% flat tax + bonus conformity stacks federal and state savings on the same study.
Read
Cost Segregation in Charleston, SC: $25K-$50K Year 1
150-year single houses pile on accumulated fixtures, piazzas, and brick courtyards — exactly what cost seg rewards. $700K rental in Cannonborough commonly reclassifies 26%.
Read
Cost Segregation in Charlotte, NC: $20K-$45K Year 1
Bank of America, Truist, Ally, Honeywell drive perpetual rental demand. NC's 4.5% flat tax + state conformity means a $400K Ballantyne SFR clears 41% combined savings.
Read
Chicago Cost Segregation
Condo-heavy inventory limits cost seg to interior-only basis. But 2-flats and greystones with basement waterproofing and rooftop decks hit 22-26% reclass.
Read
Cost Segregation in Dallas, TX: $18K-$42K Year 1
DFW's 0.88 construction cost index — among the lowest of any major metro — amplifies reclassification. No state tax means every dollar lands federal.
Read
Hilton Head Cost Segregation
POA-owned amenities shrink the 15-year bucket but multi-gen rentals push 5-year FF&E density. SC's 6.4% flat tax fully conforms — combined rate ~43.4%.
Read
Cost Segregation in Houston, TX: $16K-$38K Year 1
Houston's 0.86 construction cost index — the lowest of any major U.S. metro — pushes reclassification ratios higher. No state tax keeps the math clean.
Read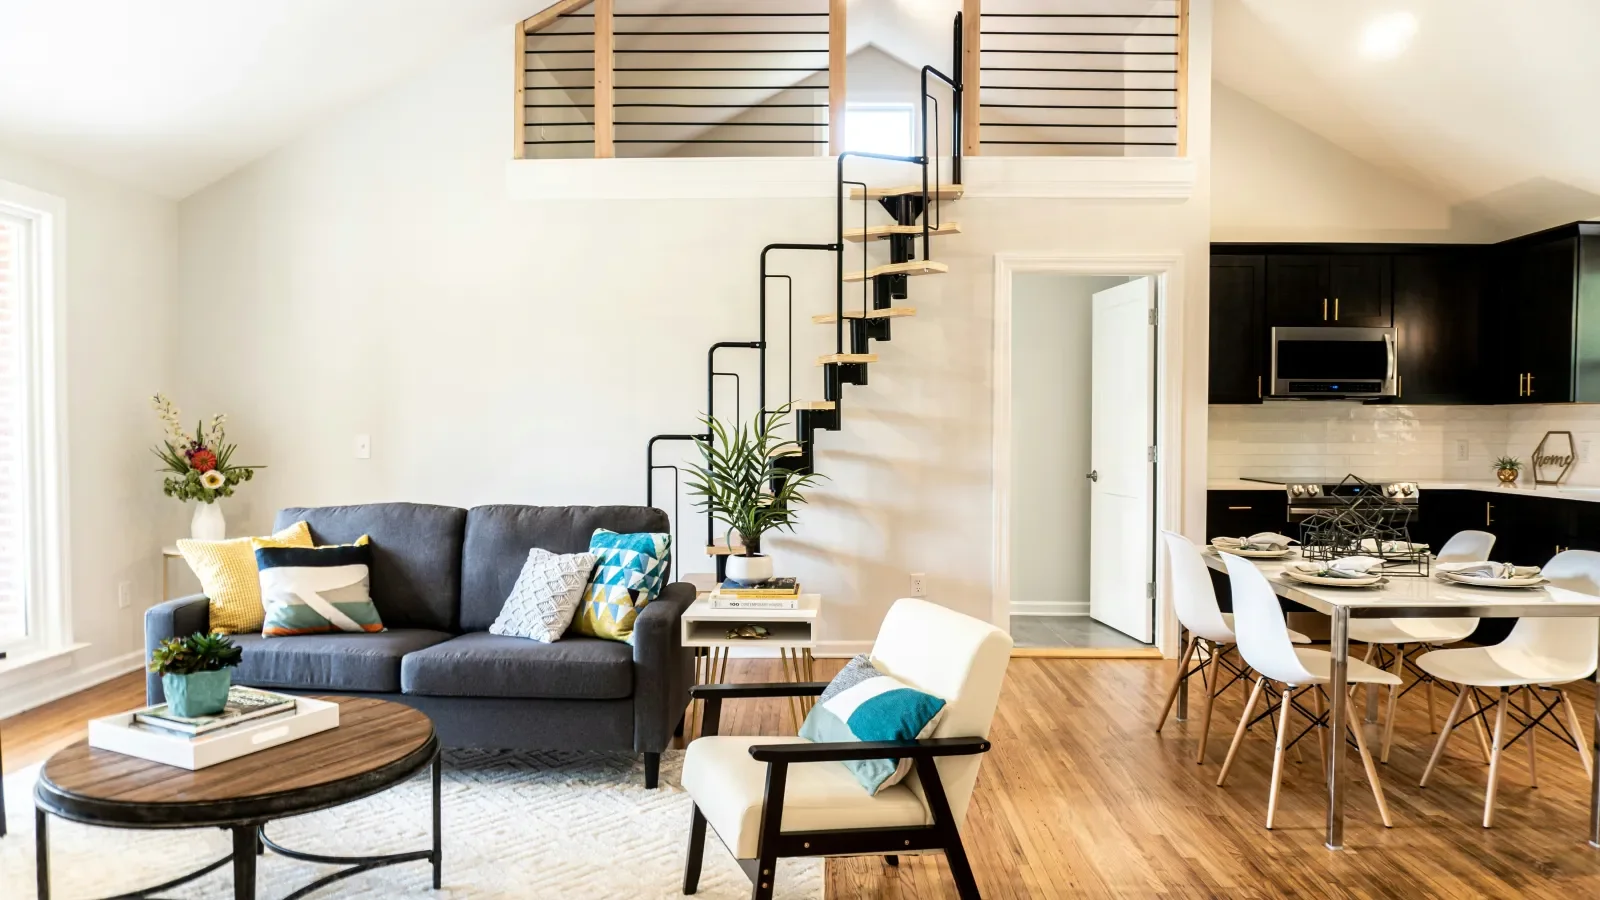
Cost Segregation in Nashville, TN: $25K-$55K Year 1
Tennessee has zero state income tax, Nashville STR permits are non-transferable, and East Nashville rentals reclassify 17%+ — a tax-shelter window that's quietly closing.
Read
Cost Segregation in Orlando, FL: $20K-$50K Year 1
Champions Gate resort homes with private pools, game rooms, and themed bedrooms hit 28% reclassification — paired with Florida's zero state income tax.
Read
Cost Segregation in Portland, OR: $24K-$52K Year 1
Oregon's 9.9% top state rate plus federal pushes combined marginal above 46% — and Portland's pre-1960 fourplex inventory layers multiple 5-year kitchens onto every study.
Read
Cost Segregation in Raleigh, NC: $20K-$48K Year 1
Apple's $1B Triangle campus, Google Durham, Epic Games — RTP tech RSU income hits the 37% bracket and a Cary rental's accelerated deductions land directly against it.
Read
Cost Segregation in Salt Lake City, UT
Silicon Slopes RSU compensation collides with Park City ski-rental tax shelter — a Lehi-to-Deer Valley setup that turns one cost seg into a W-2 offset machine.
Read
San Antonio Cost Segregation
Joint Base San Antonio's 80,000-personnel PCS cycle drives furnished MTR demand that reclassifies like STR — Texas zero state tax keeps the math clean.
Read
Cost Segregation in San Diego, CA: $40K-$85K Year 1
California's 13.3% state rate plus federal pushes SD investors above 50% combined — and Pacific Beach STR permit caps make existing licenses a regulatory moat.
Read
Cost Segregation in Scottsdale, AZ: $45K-$95K Year 1
Heated pools, casitas, outdoor kitchens, putting greens, and fire pits — desert luxury STRs hit 27% reclassification because every backyard amenity is 15-year property.
Read
Cost Segregation in Seattle, WA: $30K-$65K Year 1
Time a Form 3115 lookback to an Amazon, Microsoft, or Meta RSU vesting year — accelerated depreciation lands directly against six-figure equity income at 37%.
Read
Tampa Cost Segregation
Hillsborough's 30-day rule blocks STR but the Form 3115 lookback on 2020-2022 peak-buyer LTRs is where Tampa cost seg dollars actually live in 2026.
Read
Cost Segregation in Las Vegas, NV: $25K-$70K Year 1
Pool homes are the Clark County norm — outdoor improvements push 15-year land bucket. Zero state tax + STR material participation can offset W-2 income.
Read
Cost Segregation in Jacksonville, FL: $20K-$60K Year 1
Florida's largest city by area (875 sq mi) — beach STRs, NAS Jacksonville military demand, and zero state tax across $300K-$800K of inventory variety.
Read
Cost Segregation in Minneapolis, MN: $25K-$75K Year 1
MN's 9.85% rate (highest non-coastal) plus 37% federal = 47% combined marginal. Pre-1930 Uptown fourplexes with lake docks hit upper-end reclass.
Read
Cost Segregation in NYC: $50K-$150K Year 1
Federal 37% + NY State 10.9% + NYC 3.88% = ~51.8% combined marginal — the highest cost-seg ROI per accelerated dollar of any U.S. market. Brownstones make the math obscene.
Read
Cost Segregation in Boston, MA: $30K-$100K Year 1
Triple-deckers — three kitchens, three baths per building — push reclassification to 28-32%. MA millionaire's surtax means 46% combined rate on every accelerated dollar.
Read
Cost Segregation in Washington, DC: $35K-$100K Year 1
DC's tri-jurisdictional 47.8% combined marginal rate and pre-1900 row house stock make every accelerated dollar worth nearly 50 cents in real tax savings.
Read
Cost Segregation in San Francisco, CA
$2M+ Victorian two-units plus a 1.40 construction cost index (highest in U.S.) — even with CA's bonus decoupling, the federal benefit alone is enormous on Bay Area basis.
Read
Cost Segregation in CO Springs, CO: $20K-$60K Year 1
Five military bases drive 50K+ PCS-rotation tenants. Colorado's 4.4% flat tax conforms to federal bonus, so a $425K Fountain SFR pulls $15K-$35K Year 1.
Read
Cost Segregation in Asheville, NC: $20K-$65K Year 1
12M annual visitors fuel Blue Ridge cabin STRs at $500K-$900K. NC's flat 4.5% tax + outdoor amenities (hot tubs, fire pits, decks) push 15-year reclassification.
Read
Cost Segregation in Myrtle Beach, SC: $15K-$50K Year 1
20M annual visitors, $250K–$450K furnished condos, and South Carolina's 6.4% top rate make the Grand Strand the East Coast's cheapest entry into resort STR tax shelter.
Read
Cost Segregation in Park City, UT: $30K-$100K Year 1
Ski-in/ski-out Deer Valley and Canyons condos with hot tubs and heated boot rooms reclassify above 26% — Utah's 4.65% flat tax conforms cleanly to federal.
Read
Cost Segregation in Big Bear Lake, CA: $15K-$55K Year 1
LA's mountain playground pulls year-round STR demand. CA decouples from federal bonus — but the 37% federal benefit alone covers a $525K cabin's hot-tub-and-fire-pit math.
Read
Cost Segregation in Denver: $25K–$60K Year 1 Savings
Front Range tech and finance W-2 earners stack with mountain-town STR portfolios. Colorado's 4.4% flat tax fully conforms to federal bonus depreciation.
Read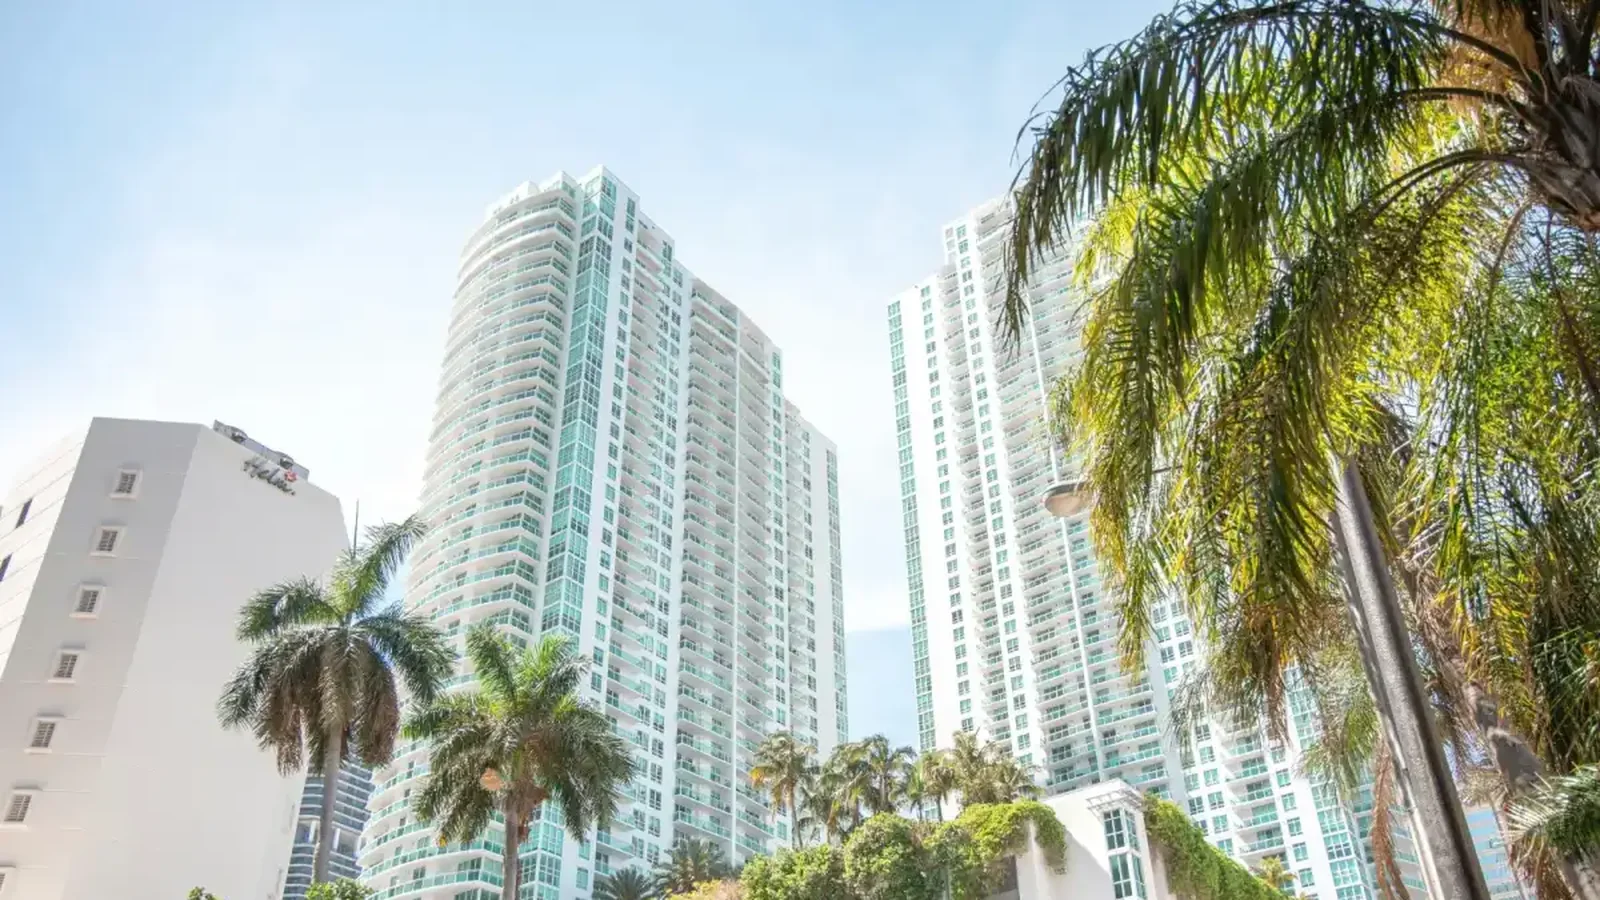
Cost Segregation in Miami, FL: $40K-$120K Year 1
South Beach, Brickell, and Wynwood luxury STRs ($600K-$1M+) plus zero state tax. Pool and patio assets push reclass to the top of the STR range.
Read
Cost Segregation in Phoenix, AZ: $15K-$60K Year 1
Mesa, Tempe, and Chandler are stuffed with 2015+ tract homes ($400K–$650K) — modern HVAC plus Arizona's 2.5% flat tax make this a top-tier cost-seg market.
Read
Cost Segregation in Smoky Mountains, TN
Pigeon Forge revenue is down 30–40% from peak, but your $725K cost basis didn't move — that locked-in number is exactly what cost seg accelerates against.
Read
Cost Segregation in Lake Tahoe, CA: $50K-$90K Year 1
An invisible state line splits Tahoe — Incline Village (NV, 0% tax) vs Tahoe City (CA, 13.3% top rate). Year-round ski + summer demand on $700K-$2M cabins.
Read
Cost Segregation in Outer Banks, NC: $30K-$68K Year 1
8-to-12-bedroom OBX mega-houses with three kitchens, pools, and elevators reclassify at 27–32% — the highest residential STR percentages in the country.
Read
Cost Segregation in Key West, FL: $50K-$120K Year 1
ROGO permit caps lock supply. Historic Old Town cottages with Dade County pine, tin roofs, and cisterns hit 23-27% reclass at zero state tax.
Read
Cost Segregation in Los Angeles, CA: $50K-$200K Year 1
$1.5M+ basis with a 50%+ combined marginal rate. LA rentals carry 3-4x the cost seg dollars of Midwest peers — even with CA's 5-year state-level phasing.
Read
Cost Segregation in Gulf Shores, AL: $20K-$40K Year 1
Entry prices run 20-40% below Destin/PCB but rents match. Alabama's 5% state tax means combined federal + state savings on every reclassified dollar.
Read
Cost Segregation in Maui, HI: $45K-$75K Year 1
Hawaii's 11% state rate fully conforms to federal bonus — 30% more total benefit than no-tax states. On-island managers can hit material participation.
Read
Cost Segregation in Destin & PCB, FL: $25K-$50K Year 1
Furnished Emerald Coast STRs hit 25-30% reclass — among the highest of any property type. Pool decks and boardwalks add 15-year land improvements on top.
Read
Cost Segregation in Austin, TX: $30K-$80K Year 1
STR license freeze made existing inventory scarce, but your $825K basis is locked at purchase price — not today's $600K appraisal. The market shifted; the tax code didn't.
Read
Cost Segregation in Savannah, GA: $30K-$60K Year 1
Jones Street row houses with 150-year-old wrought iron, brick courtyards, and gut-rehabbed kitchens hit 27% reclassification — historic stock is unusually short-life-rich.
Read
Cost Segregation in Joshua Tree, CA: $30K-$50K Year 1
Furnished desert cabins hit 26-32% reclass thanks to pools, hot tubs, xeriscape. CA's 50.3% combined marginal rate makes deductions worth more than anywhere.
Read
Cost Segregation in Sedona, AZ: $40K-$70K Year 1
The 2022 STR permit cap turned existing licenses into a regulatory moat — and Sedona's spa amenities, fire pits, and xeriscape push reclassification to 26–30%.
Read