How our cost segregation engine works
Engineering-based cost segregation methodology, calibrated against industry-standard 2026 construction cost data component pricing, validated by a 16-check QC system, and aligned with the IRS Cost Segregation Audit Techniques Guide.
A cost segregation study reclassifies portions of a building from 27.5- or 39-year property into 5-, 7-, and 15-year property — accelerating depreciation and frontloading deductions. Our engine implements engineering-based cost segregation methodology consistent with the IRS Cost Segregation Audit Techniques Guide (Pub 5653).

Who stands behind this methodology
Every report is reviewed before finalization by our Technical Lead. If your CPA flags an issue with a report, we revise it at no charge — our CPA-Ready Guarantee. And if the IRS ever questions a study, we respond directly to your CPA's questions at no charge. See our classification philosophy — why bigger deductions aren't always better.
1. Data inputs and remote observation
We perform engineering-based cost segregation studies remotely. The IRS does not require an on-site inspection — Pub 5653 explicitly recognizes that engineering-based studies can be performed using documentary evidence, photographs, and reliable secondary data sources. Our inputs are:
- Customer-supplied: closing documents, tax assessment, construction documents and property inspection report (where available), property photos, year built, square footage, purchase price, basis allocation between land and building.
- County assessor data via RentCast: building class, year built, lot size, improvement value, land value.
- OpenStreetMap: building type, footprint, landuse classification — used for cross-verification.
- Industry-Standard 2026 Construction Cost Data: the engineering-grade reference for component pricing.
- BLS Producer Price Index (Construction): regional and time-period cost adjustment.
2. Land valuation
Land is non-depreciable, so the basis allocated to building (vs. land) directly determines what's available to reclassify. Our land valuation pipeline runs in priority order:
- User-supplied override (CPA-validated land allocation), if provided.
- County assessor land/improvement ratio (with reliability gating and damping for outliers).
- Statistical model: metro-level land ratio → state-level → national fallback, with price/sqft adjustment for premium markets.
3. MACRS classification
Components are classified into MACRS asset classes per IRS Pub 946 and Rev. Proc. 87-56 class-life tables (reproduced in Pub 946, Appendix B; see also our cost-segregation legal history reference for the full statutory chain from ERTA 1981 through OBBBA 2025):
- 5-year property: personal property — interior finishes, decorative lighting, removable carpet, FF&E, specialty equipment. For specialty commercial verticals like data center cost segregation, this bucket also includes UPS systems, server racks, precision cooling (CRAH/CRAC), PDUs, and fire suppression.
- 7-year property: office furniture, certain equipment.
- 15-year property: qualified land improvements — site work, paving, fencing, landscaping, certain exterior lighting.
- 27.5-year (residential) or 39-year (commercial): structural building components — foundation, framing, roofing, exterior walls, plumbing rough-in, electrical rough-in, HVAC distribution.
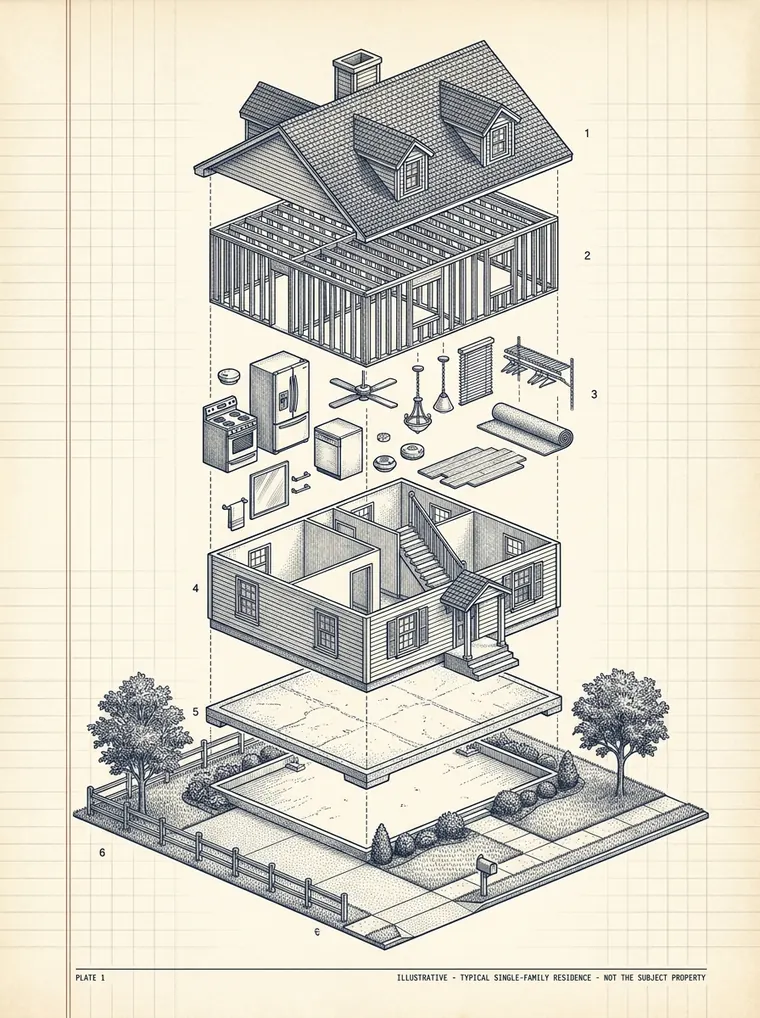
Every building is really three tax lives
Cost segregation is the engineering analysis that identifies which numbered layers can leave the slow structural class for faster ones.
Illustrative — a typical single-family residence, not a specific building. Actual class allocations are engineered per property.
4. Multiplier stack
Component base costs are adjusted through a deterministic multiplier stack:
- Geographic cost index — 6-tier hierarchy: pinned metros → calibrated metros → manual metros → state → region → national fallback.
- Construction quality — economy / standard / premium / luxury, derived from price/sqft, age, and OSM finish hints.
- Property-type component adjustment — STR vs. SFR vs. multifamily vs. office vs. retail vs. industrial each get distinct component weights.
- Property-seeded calibration — deterministic adjustments derived from each property's own attributes, applied within calibrated component bounds. The same inputs always produce the same result.
- STR intensity uplift — additional FF&E for short-term rentals.
- Bonus depreciation flag — currently 100% per OBBBA (2025+).
- BLS PPI time index — adjusts industry-standard 2026 construction cost data baseline to current-year dollars.
- Indirect costs — soft costs at 25% of hard costs.
5. Reconciliation to purchase price
Component costs are reconciled to the actual depreciable basis using a single scalar — S = adjusted_basis / total_unadjusted. This guarantees the reclassification adds up to exactly the property's depreciable basis, no more and no less. The unscaled diagnostic ratio (rf_raw) is preserved for QC validation.
6. QC validation (16 checks)
Every report runs through a 16-check QC validator before delivery. Checks span:
- Hard invariants — does total reclassification equal depreciable basis?
- Market regime — does land/building ratio match the metro band?
- Calibration outliers — is acceleration percentage within property-type-specific bounds?
- Input quality — are user-supplied inputs internally consistent?
- Narrative safety — are the AI-generated narrative sections aligned with the numerical results?
A single soft flag with otherwise in-band metrics gets downgraded to a warning ("compound-OK" rule). Any hard-invariant violation halts the report. Multi-flag reports are held for internal technical review before release.
7. PDF report
The 30+ page report includes: executive summary, MACRS class allocation pie chart, year-by-year depreciation schedule, component-by-component breakdown, methodology section, data sources & observation methodology disclosure, QC summary, and a CPA Review Page that summarizes the file in the language a CPA needs to file Form 4562 (or Form 3115 for lookback adjustments).
Related regulation references
- Regulations hub — canonical reference for the federal tax rules that govern cost segregation outcomes.
- Real Estate Professional Status (REPS) — the 750-hour and 51% tests under § 469(c)(7).
- The 75/55 rule (STR loophole) — Treas. Reg. § 1.469-1T(e)(3)(ii).
- Form 3115 catch-up depreciation — automatic change-number 7 and § 481(a) adjustment.
- Treas. Reg. § 1.469-1T — full reference + six (A)–(F) exceptions.
What our methodology is not
We do not perform on-site inspections. We do not produce estimates dressed up as studies — every report is a fully reconciled engineering-based cost segregation study using primary documentary evidence and reliable secondary data. We do not provide individualized tax advice; we deliver an reclassification analysis aligned with IRS guidance your CPA uses to file your return.
Want to see the methodology in action? View a sample report or get a free preliminary estimate for your property.
Frequently asked
Is a Cost Seg Smart study audit-defensible without a site visit?
Yes. The IRS Cost Segregation Audit Techniques Guide (Pub 5653) does not require a site visit; it requires component-level documentation traceable to a calibrated cost source. We use industry-standard 2026 construction cost data, county assessor records for land allocation, OSM building-type classification, and satellite imagery for site-work verification. Every report includes internal technical review & QC and a methodology section that addresses the 13 IRS ATG quality elements. If the IRS questions a study, we respond directly to your CPA at no charge.
What does 'industry-standard 2026 construction cost data' mean, and why does it matter?
Nationally-recognized construction cost databases are the industry-standard cost reference, used by professional engineering firms, government agencies, and insurance underwriters to value building components by region and quality tier. The current edition includes ~30,000 line items priced by city. We use it as the underlying $/SF cost basis for every component classification — appliances, flooring, cabinetry, HVAC, plumbing, structural shell, site work — calibrated by a regional construction-cost multiplier and BLS PPI time index. The same source large engineering firms cite.
Why is the methodology identical to a $10K firm at our price?
Because the methodology has been public and unchanged for years. industry-standard construction cost data, IRS Pub 946 depreciation rules, Rev. Proc. 87-56 asset class lives, and the 2017 IRS Audit Techniques Guide are all open documentation. What used to require a custom engagement per property — discovery calls, site visits, hand-built reports — is now standardizable across thousands of properties using structured property data. The bottleneck wasn't the engineering; it was the labor model. We rebuilt the workflow without changing the methodology.
How is land valued?
Land allocation runs through a four-step pipeline: customer override (if specified) → county assessor record (with reliability gate and damping) → metro/state statistical model → national fallback. Coastal markets (Pacific Beach, Manhattan, Coronado) typically run 40–55% land allocation. Inland workforce markets typically run 18–25%. The full reconciliation logic is documented in the report, including which source was used and the reliability tier. For premium-land properties (high-cost metro + high $/SF) the engine applies a floor to prevent unreasonably small depreciable basis.
What if the IRS examines my study?
You forward the examination notice to your CPA, and your CPA forwards it to us. We respond directly to your CPA's questions at no charge — methodology citations, industry-standard cost-data line-item evidence, MACRS classification per component, internal technical review. The report is built from the start to address the 13 IRS ATG quality elements (Pub 5653 §3.4). In practice IRS examinations of cost-seg studies are rare for residential and small-commercial properties; when they happen, the response is paperwork, not litigation.
Can my CPA modify the report or schedule?
Yes — and they often do. The depreciation schedule, MACRS classification table, and Form 3115 §481(a) section are all line-item editable. Your CPA may adjust for taxpayer-specific factors (passive-activity grouping, REPS election, basis adjustments from §1031 carryover) that aren't in our scope. We provide the engineering basis; they adapt it for your return. If your CPA flags an issue with the report, we'll revise at no charge under our CPA-Ready Guarantee.
Last reviewed: May 2026. Maintained by the Cost Seg Smart Editorial Team. Updated for 100% bonus depreciation under the One Big Beautiful Bill Act (signed July 2025), permanent for 2025+.