Cost segregation report example — worked examples by property type.
Pick the property type that matches yours. We’ll email you the full 40+ page CPA-ready PDF example for that type — STR, SFR, multifamily, office, retail, industrial, manufacturing. One sample, one email, no catalog dump. What each section of the report is for: what a cost segregation study contains.
Each sample below is a full Cost Seg Smart study modeled by our engine on an illustrative property, not a client’s. Pick your property type to see the full report — component breakdown, MACRS schedules, methodology — and the illustrative reclassification it produced. The IRS Audit Techniques Guide (Pub 5653) warns against template-based studies, so every defensible report is built from the specific property's components.
See a full report example for your property type.
Figures below are transcribed from each downloadable sample and reconcile to the report. Illustrative — actual reclassification varies with the property. Not a benchmark.

Residential
Single-family and short-term rentals, condos and townhomes, brownstones and ADUs.
8 samples


Documented cost
Studies built from an actual cost ledger rather than a purchase price — a build you paid for line by line, or improvements to a property you already own.
2 samples 
Multifamily
Duplex through fourplex, and 5+ unit apartment buildings. Portfolio bundles available.
4 samples



Commercial
Office, retail, restaurant, industrial, medical. Site visits routine at $3M+ basis.
8 samples



Specialty
Storage, dealerships, fuel, vet, fitness, day care, worship, data centres. Larger facilities by proposal.
12 samples


3 more specialty samples
CPA private-label
The same report, branded for your firm.
2 samples What an actual report looks like, page by page.
Pages from the warehouse sample. Every property type follows the same structure.
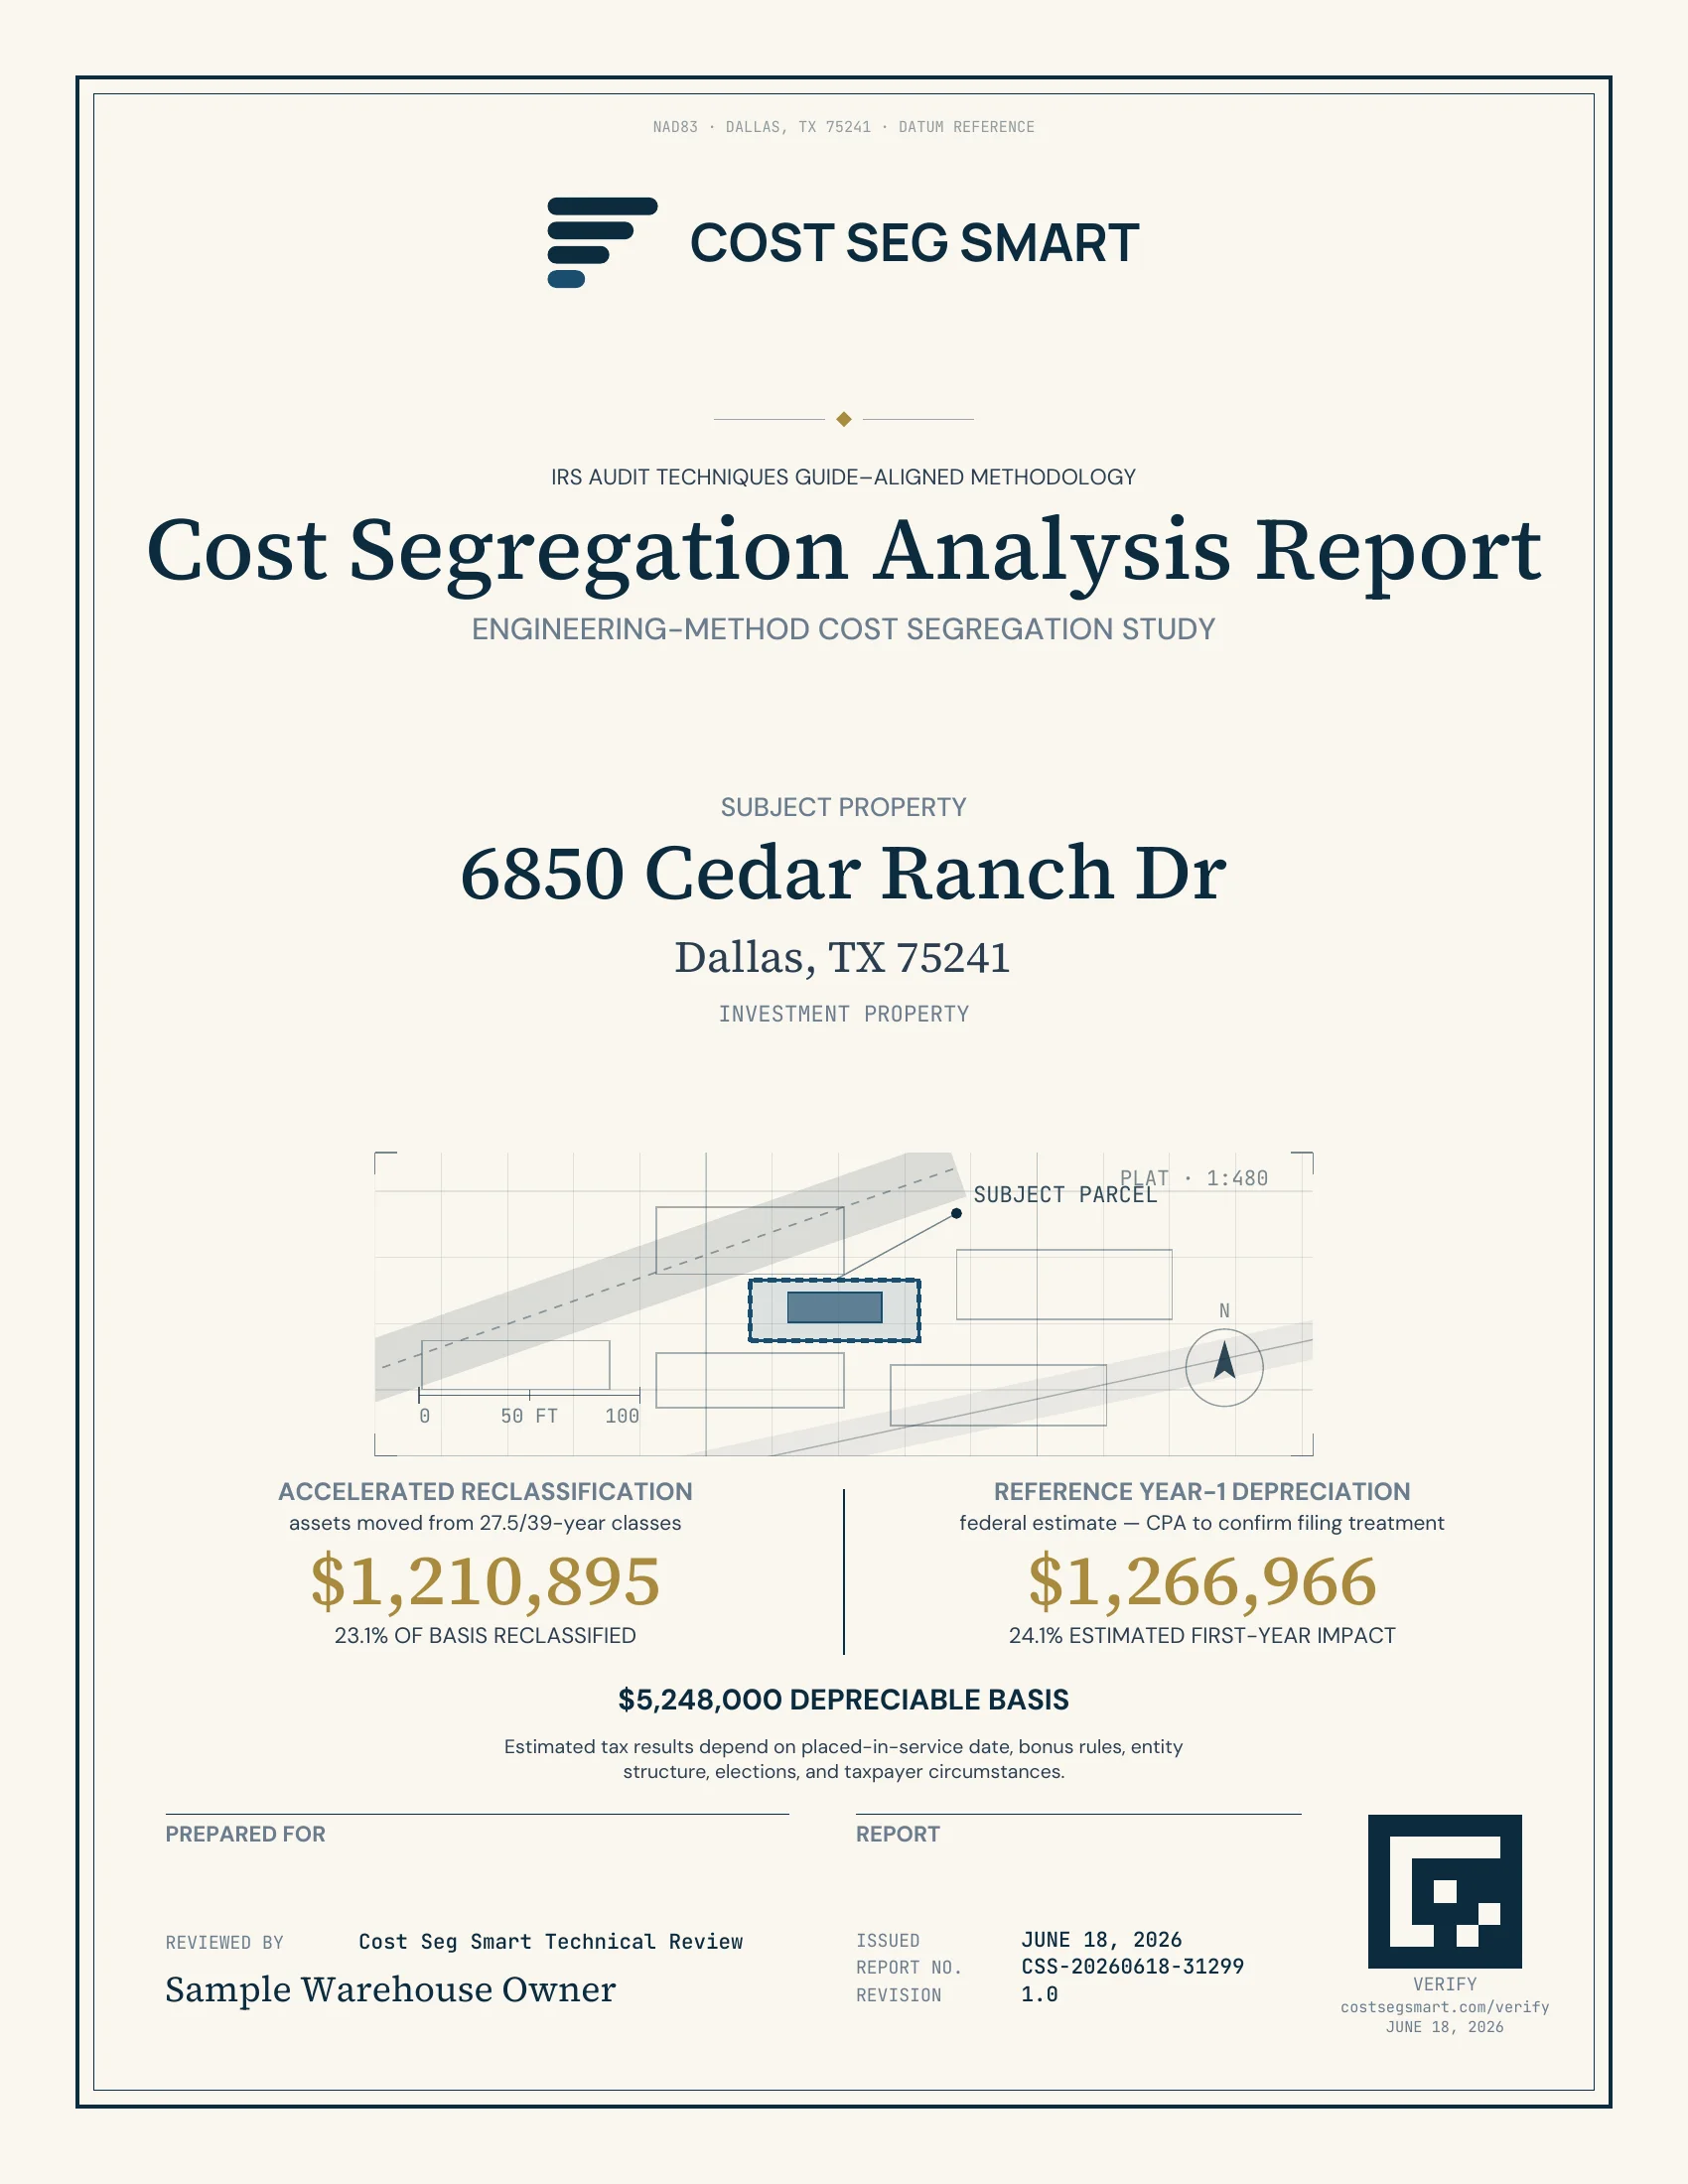
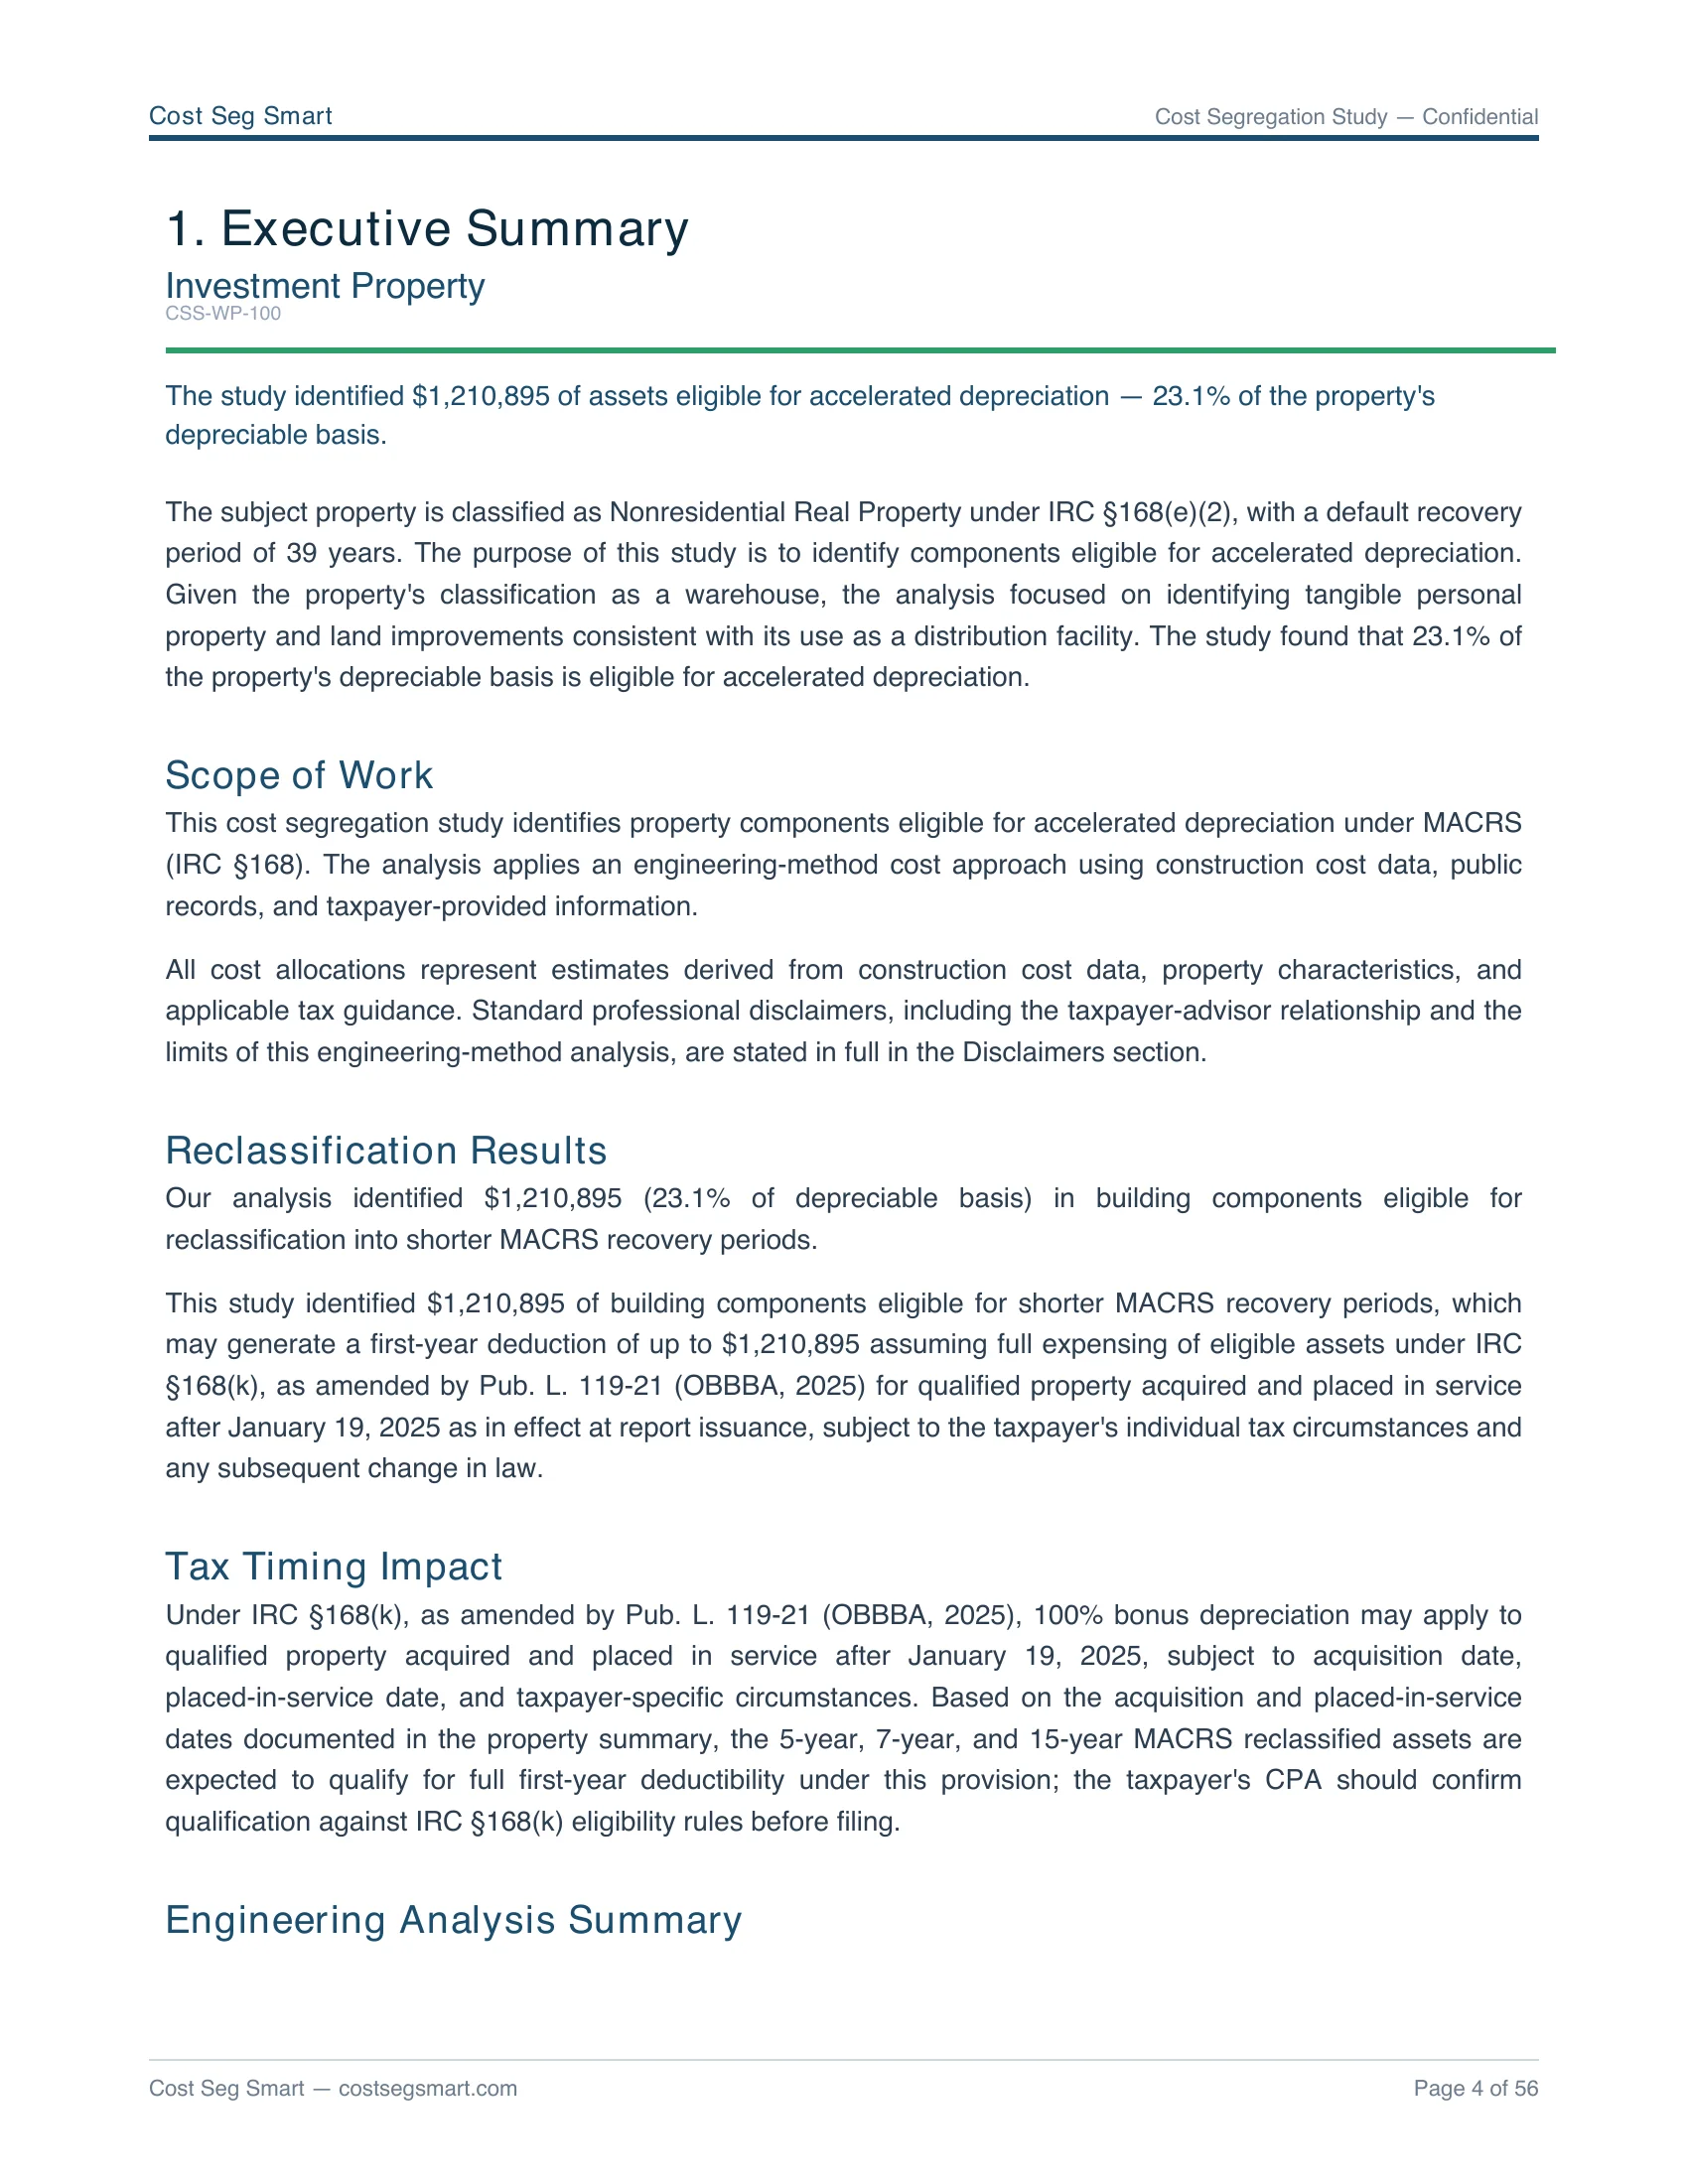
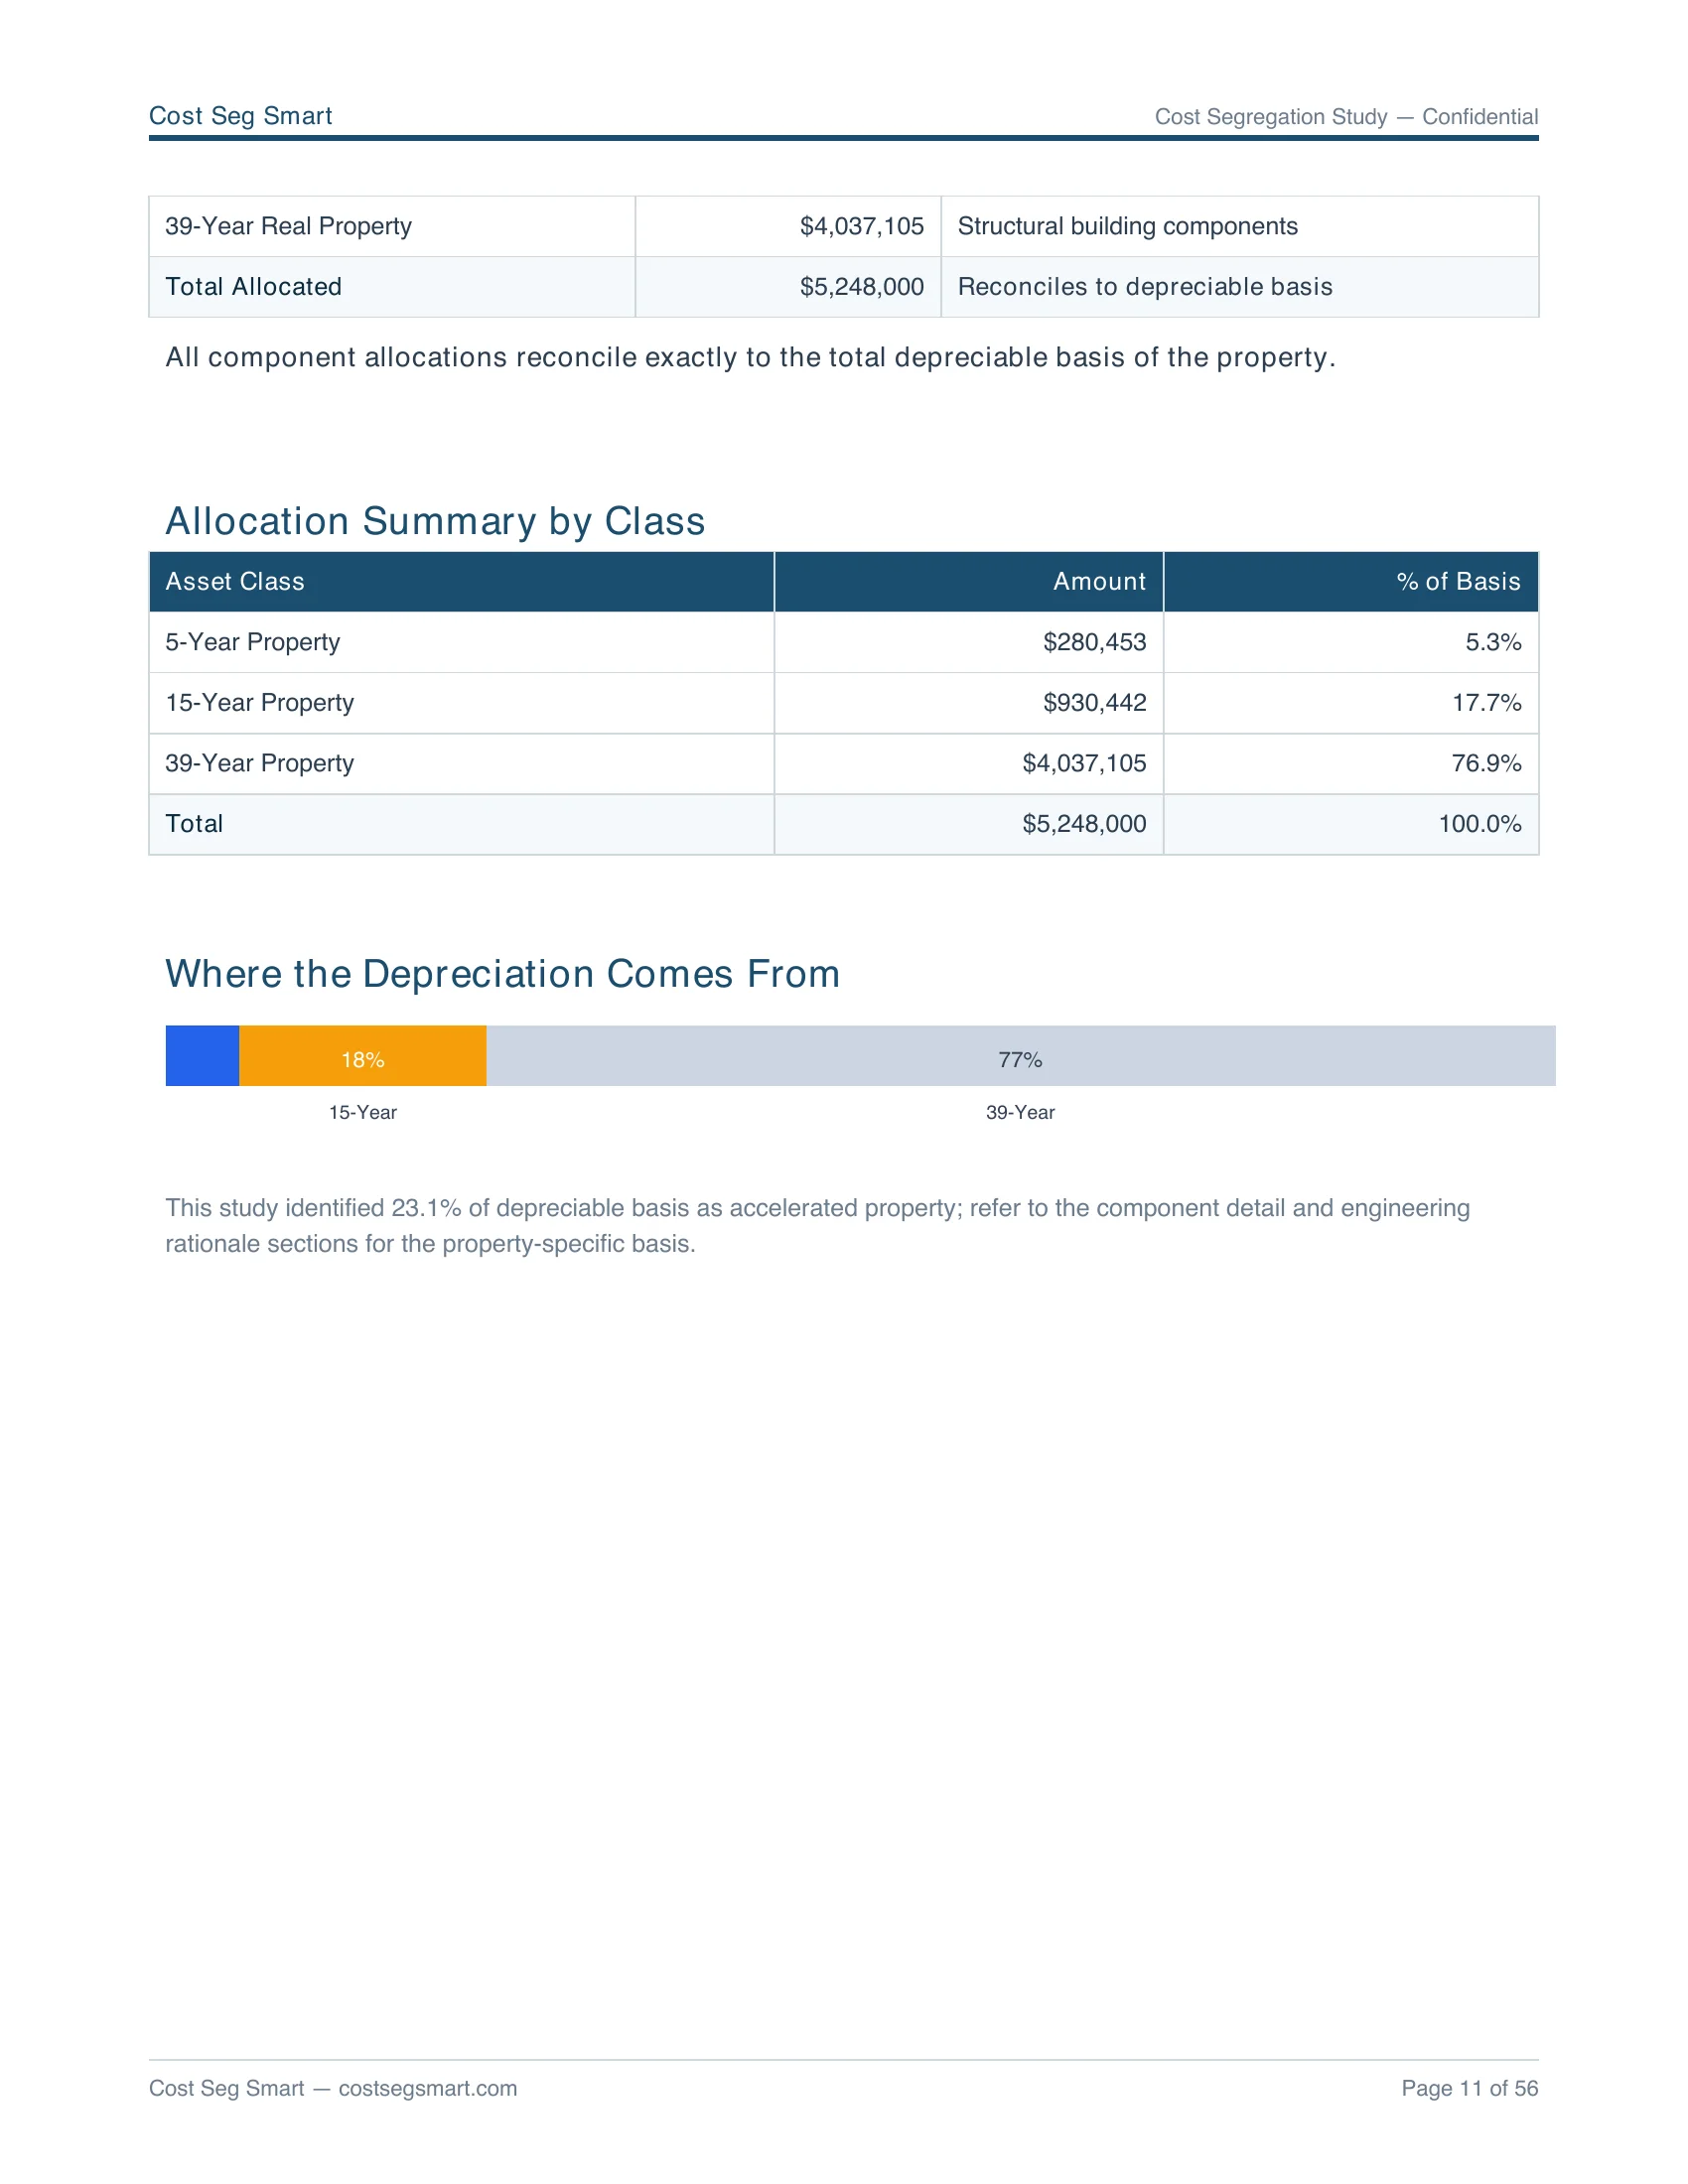
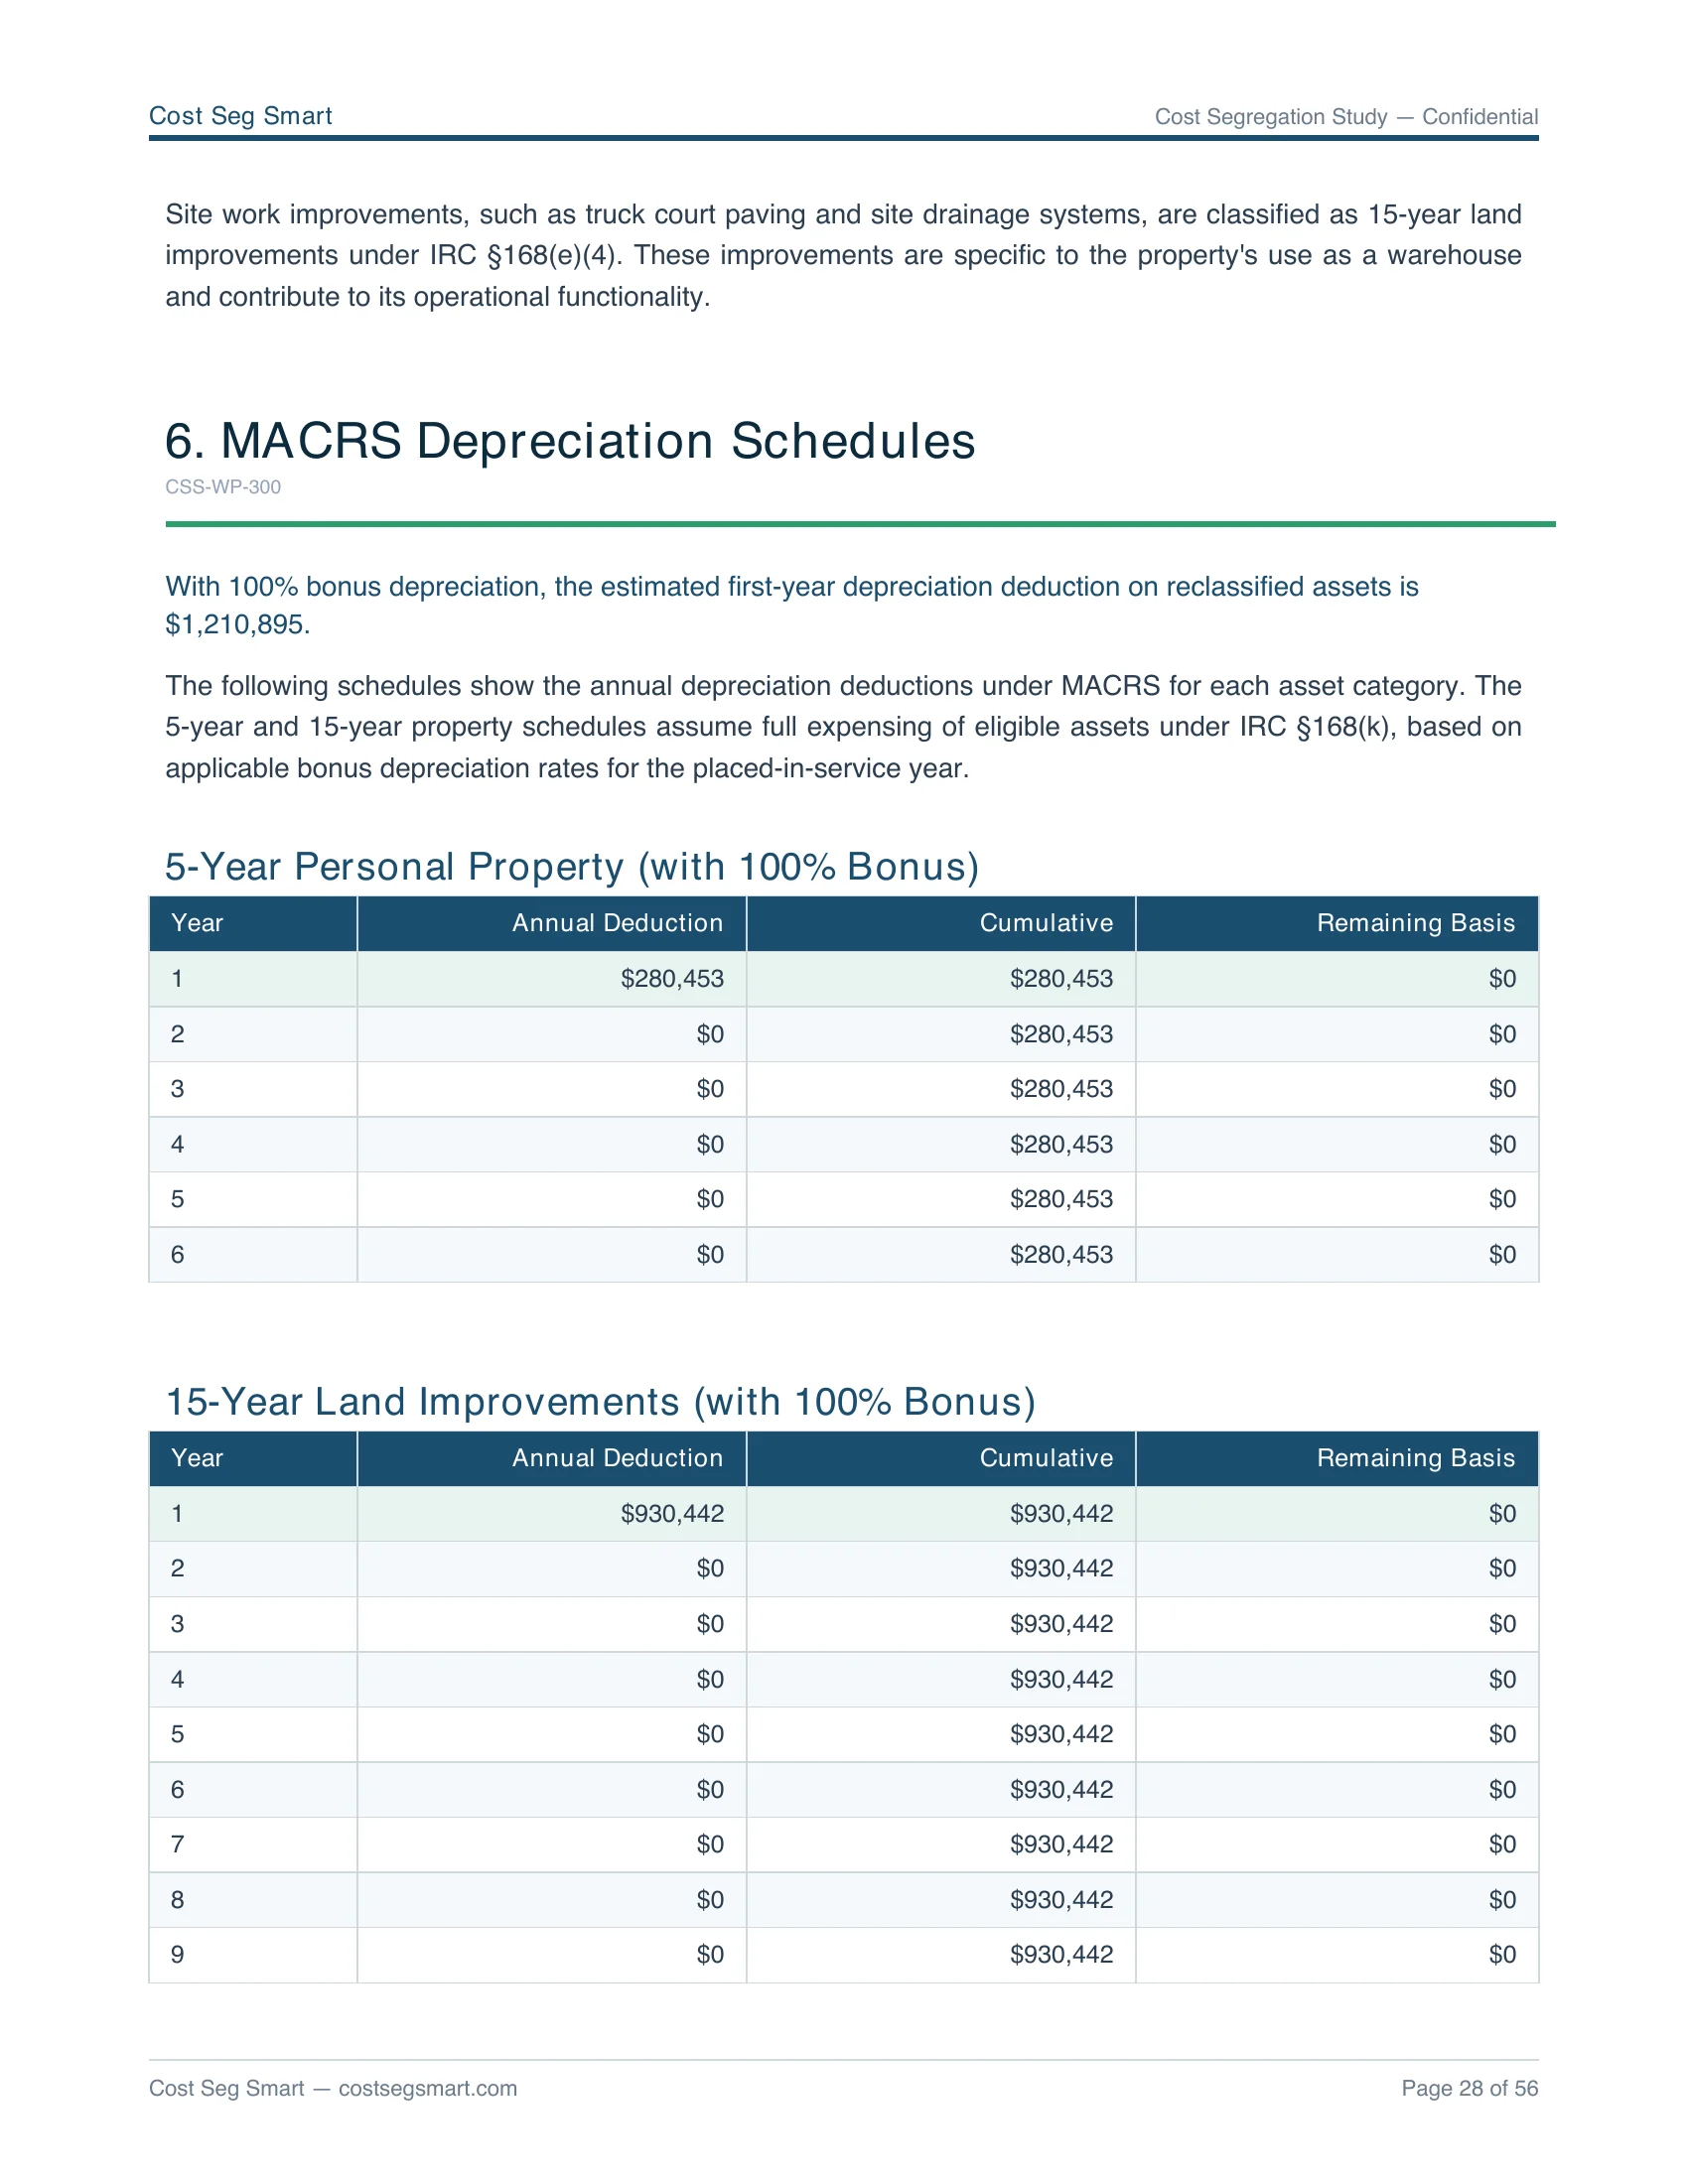
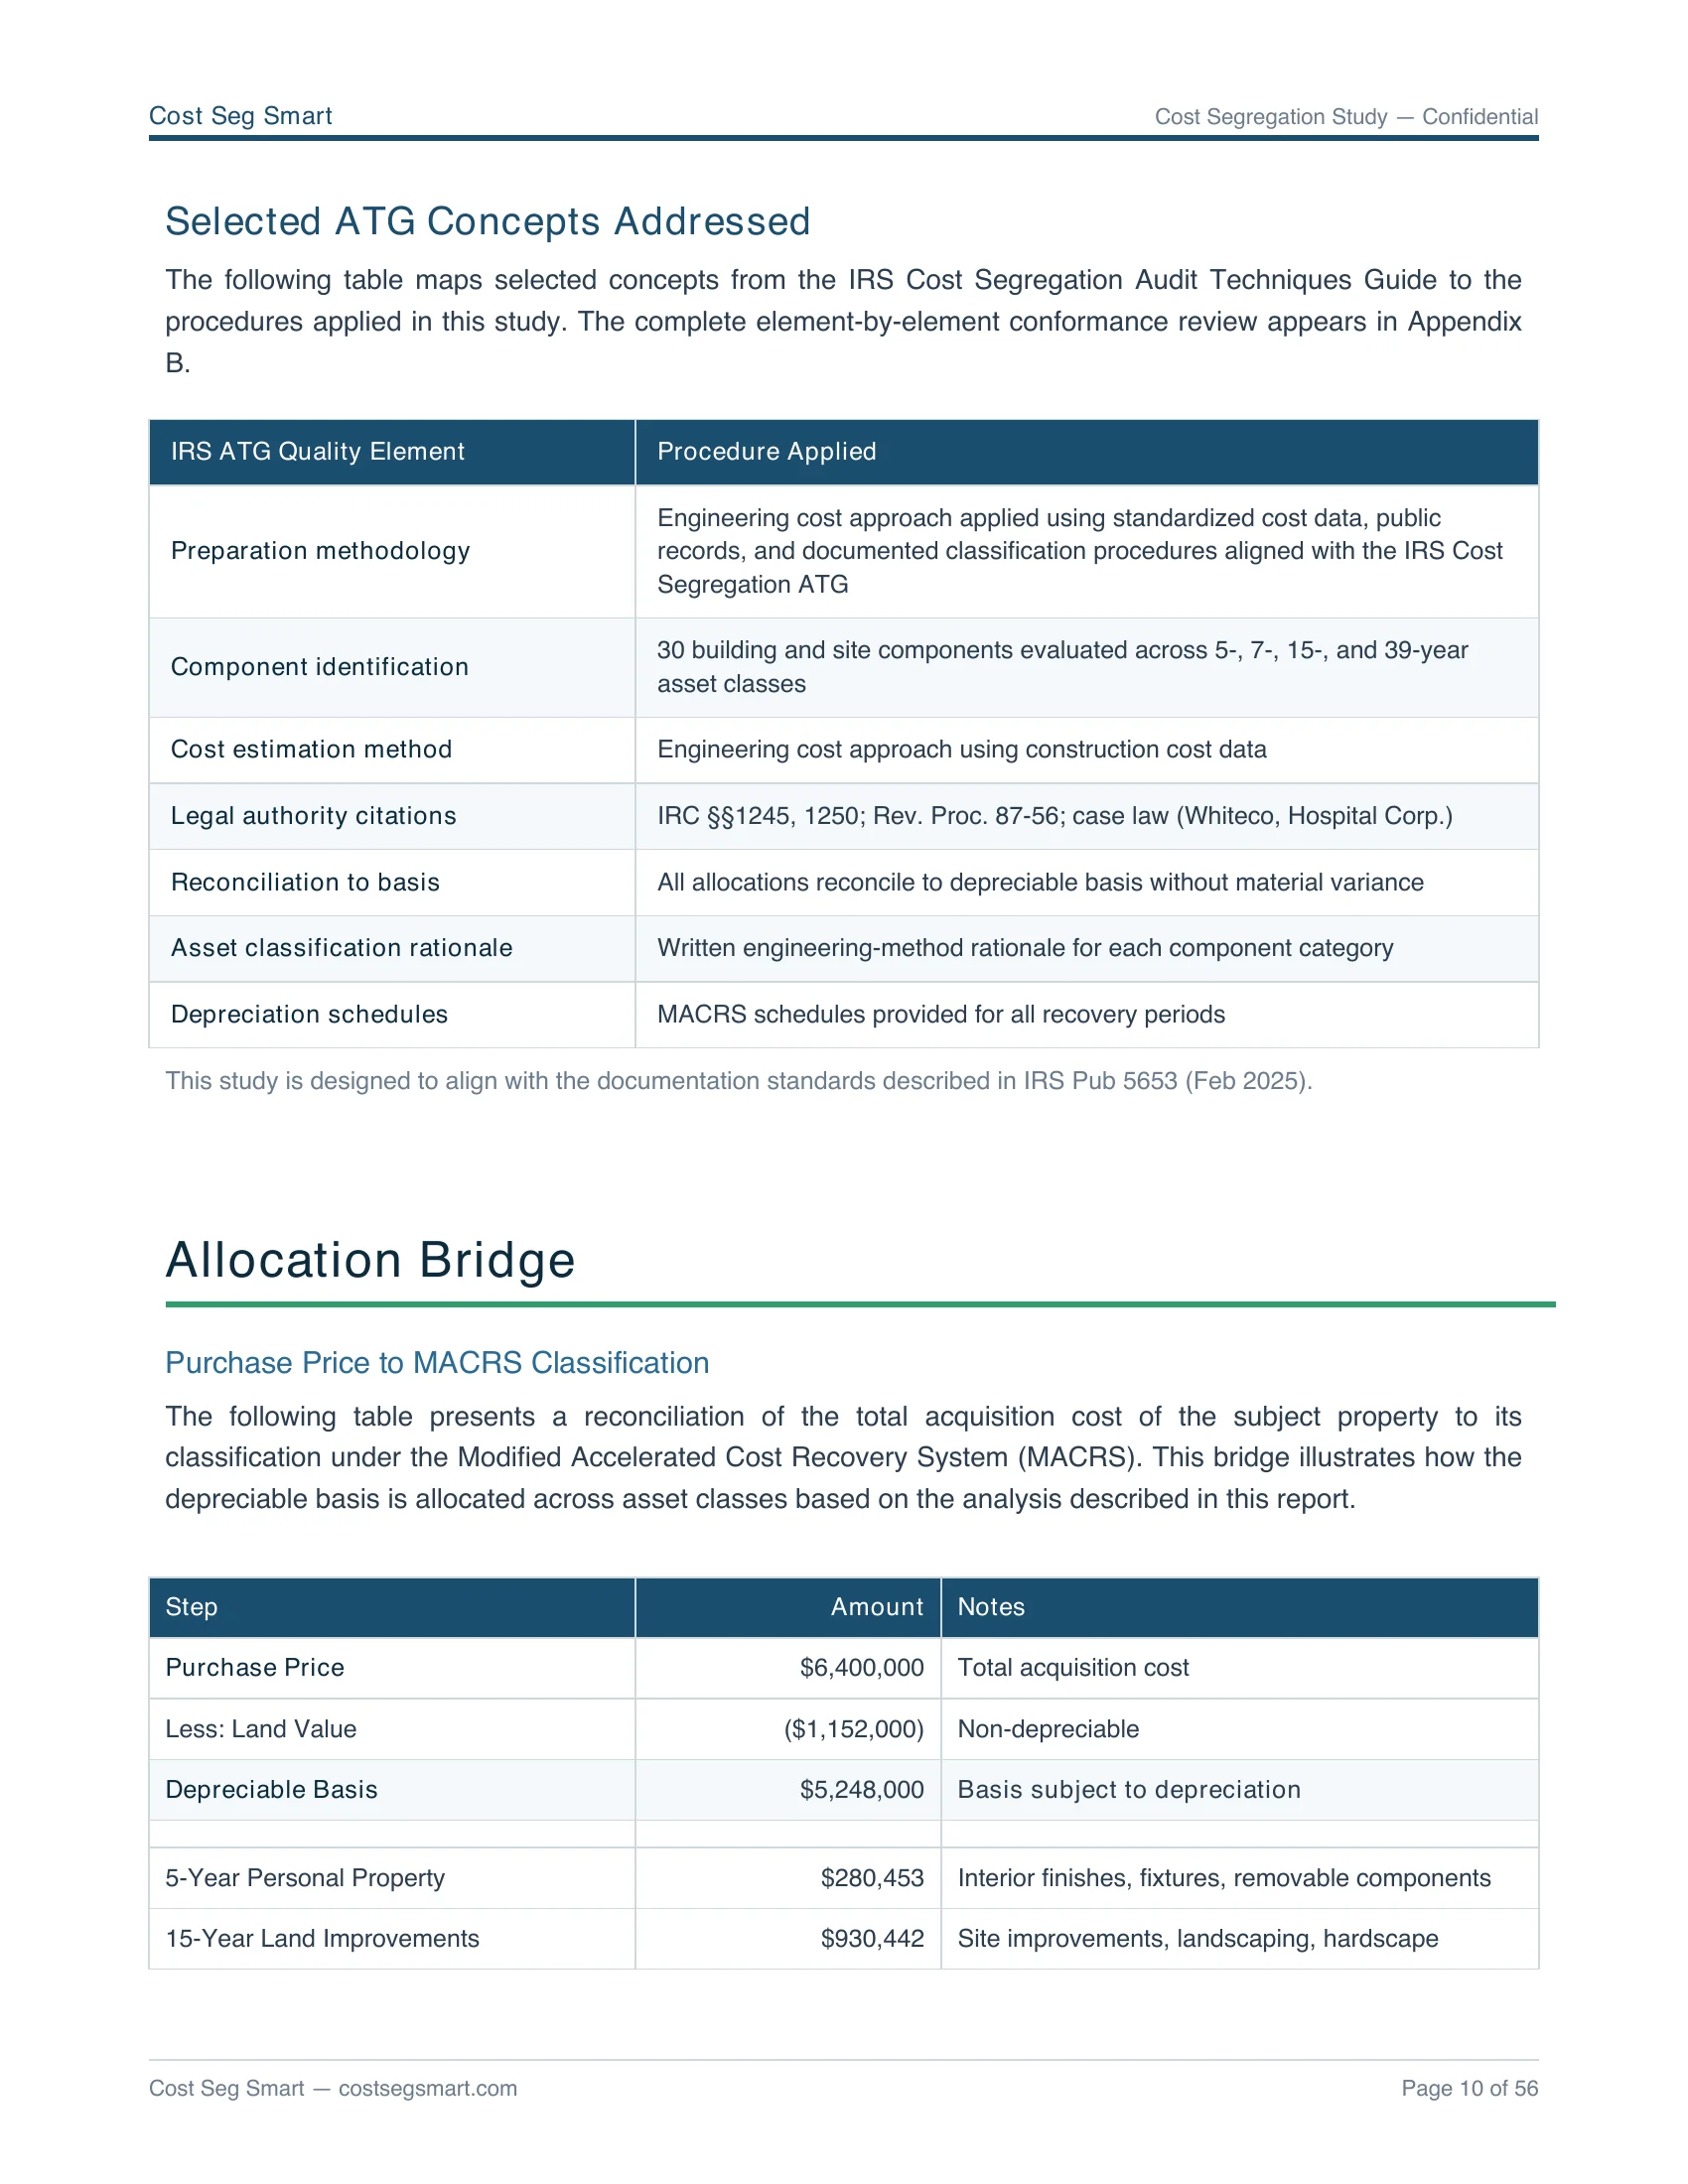
A one-page preliminary cost segregation analysis with your address, your Year-1 federal deduction, and 5-year schedule. Designed for investor and CPA review.
Get the preliminary analysis →What a cost segregation report example actually contains
Every cost segregation report example linked above is a full study modeled by our engine on an illustrative property — the same 40+ page CPA-ready format we deliver to paying clients. The picker is keyed by property type so the example matches your asset's depreciation profile: STR, SFR, duplex, triplex, multifamily 5+, office, retail, or industrial. Each report walks through MACRS reclassification (5/7/15-year property), basis reconciliation, and Form 3115 §481(a) lookback math where applicable.
"Example" and "sample" mean the same thing in our deliverable taxonomy: a full engine-generated report on an illustrative property, not a template. The FAQ below covers what each one contains and how each report differs from a benchmarks summary or a methodology overview.
Looking for something other than a report example? A cost segregation calculator estimates your Year-1 number in about 60 seconds. A cost segregation Excel template gives your CPA a fixed-asset schedule format to work in (it is a worksheet, not a substitute for an engineered study). And if you want worked dollar examples by price and property type rather than full PDFs, see our cost segregation examples.
Browse your unlocked samples
You unlocked the full sample library on a previous visit. Click any tile to open the PDF.
Six sections, every report.
Each PDF follows the same engineered structure your CPA can sign off on without rework. The same structure ships at every price tier — see what's inside a cheap cost segregation study vs a traditional $5K firm's study. For the full audit-defensibility methodology behind these reports, see costsegaudit.com. See our audit-defense scope and 13 ATG quality elements for what's covered if a study is examined. For how engineering-report depth varies across the 27 firms tracked at costsegregationreviews.com, see the cross-provider methodology breakdown.
Executive Summary
Year-1 federal benefit, MACRS class allocation pie, basis reconciliation.
Component Library
Every depreciable component classified to 5/15/27.5/39 yr with §168(k) eligibility.
Depreciation Schedule
Year-by-year deduction tables for the full recovery period.
Land Valuation
County-assessor cross-check or statistical fallback, with reliability score.
Methodology
industry-standard 2026 construction cost basis, geo multipliers, and observation methodology.
QC + Technical Review
16-check QC gate result, internal technical review & QC, and Form 3115 readiness.
What your CPA checks in a report.
- Property facts and the placed-in-service date
- Land vs. building allocation, documented and defensible
- A component-level cost schedule with MACRS recovery classes (5 / 15 / 27.5 / 39-year)
- Bonus-depreciation (§168(k)) assumptions stated explicitly
- A fixed-asset ledger schedule that drops into Form 4562
- Form 3115 / §481(a) catch-up discussion when a lookback applies
- Methodology citations and the audit-support scope if the study is examined
Looking for a cost segregation template instead?
A spreadsheet template can organize the inputs, but it can't produce the component-level cost support an examiner asks for — the engineering pricing behind each line is the study. If you want the DIY starting point anyway, we publish a free cost segregation Excel template; the sample reports on this page show what the finished, defensible version of that same schedule looks like.
Page-by-page walkthrough: what's in a cost segregation report.
The report is a deposit-grade engineering document. Your CPA files from it; an IRS examiner reads from it. Here is what to look for in each section, what to verify, and why it matters.
What's in the Executive Summary?
One-page roadmap. The Year-1 federal benefit appears in bold at the top. Below it: a MACRS class allocation pie (5-year, 15-year, 27.5-year or 39-year), the total reclassified basis, and the basis reconciliation that ties every dollar of the purchase price to a depreciation class. Verify: the sum of allocated basis equals your purchase price minus land. Why it matters: this is the single page your CPA reads first; if the reconciliation does not foot, the rest of the report is unverifiable.
How does the Component Library read?
Every depreciable component on your property, line by line, with the MACRS asset class (5, 15, 27.5, or 39 yr), Rev. Proc. 87-56 class number, depreciable basis, and §168(k) bonus-eligibility flag. Personal property (cabinetry, appliances, floor coverings, fixtures) maps to 5-year. Land improvements (parking, landscaping, fencing, exterior lighting) map to 15-year. Verify: each component carries an asset class citation (e.g. "00.3 Land Improvements") and a basis. Why it matters: an IRS examiner audits at the line-item level. Missing citations or vague descriptions are the most common cause of disallowed reclassifications.
How do I verify the Depreciation Schedule?
Year-by-year deduction tables for each MACRS class across the full recovery period. With 100% bonus depreciation restored under federal law, the 5-year, 15-year, and 7-year buckets show their entire basis fully deducted in Year 1. The 27.5-year residential (or 39-year non-residential) bucket follows the standard MACRS half-year convention. Verify: Year-1 totals match the Executive Summary headline number. Cross-check against your CPA's Form 4562 line entries. Why it matters: this is what flows onto your tax return. Errors here directly affect the deduction the IRS sees.
How is land allocated in the Land Valuation section?
Land is not depreciable, so its allocation is the single most consequential number in the report. The Land Valuation section shows either a county-assessor cross-check (the assessor's land-to-improvement ratio applied to your purchase price) or a statistical fallback (construction-cost-database-based reconstruction cost) when the assessor data is unreliable. A reliability score is attached. Verify: the land percentage is documented and defensible, not just asserted. Why it matters: a study that allocates too little to land inflates the depreciable basis and creates audit risk under the IRS Cost Segregation Audit Techniques Guide (Pub 5653) §6.03.
What does the Methodology section actually say?
The Methodology pages document the engineering basis: industry-standard 2026 construction cost data with the relevant geographic multiplier, the observation method (satellite imagery, county assessor records, owner-supplied photos), and the Rev. Proc. 87-56 asset-class assignment rules applied. The IRS Audit Techniques Guide names the "Detailed Engineering Approach from Cost Records" as the most defensible methodology when source records are available; otherwise the "Detailed Engineering Cost Estimate Approach" using industry-standard cost data is acceptable. Verify: the methodology page names the data sources. Why it matters: this is what an IRS examiner reads to decide whether the study followed accepted practice.
What does the QC + Technical Review page mean?
A 16-check quality-control gate runs before the report ships: basis reconciliation, MACRS-class sanity, §168(k) eligibility flags, land-allocation reliability, depreciation-schedule arithmetic, and 11 more checks. Our internal technical review & QC confirms that the study follows the 13 principal elements of the IRS Audit Techniques Guide (Pub 5653). Form 3115 readiness is confirmed if the property was placed in service before the current tax year. Verify: the review sign-off is dated and the QC pass timestamp matches the report build date. Why it matters: if examined, this is the cover page your CPA shows the IRS to demonstrate that the methodology was applied with engineering rigor.
Sample reports, by question.
Are these real cost segregation reports or templates?
Neither. Each one is a full Cost Seg Smart study modeled by our engine on an illustrative property, not a client's, and each one says so on its face. The IRS Audit Techniques Guide (Publication 5653) explicitly warns against template-based or rule-of-thumb cost seg studies. Every defensible study has to be generated from the specific property's component data.
What's inside a 40+ page report?
Executive summary with Year-1 federal benefit and MACRS class allocation; full component library classified to 5/15/27.5/39-year recovery periods with §168(k) bonus eligibility flagged; year-by-year depreciation schedules formatted for Form 4562; land valuation cross-checked against county assessor data; methodology citing IRS Publication 5653 and Revenue Procedure 87-56; QC results from our 16-check quality-control gate; and Form 3115 readiness notes if a lookback is appropriate.
How long does a report take to generate?
Most studies are emailed back usually the next business day after you order. The engineering pipeline runs on industry-standard 2026 construction cost data and county assessor records. The analysis itself is automated, but the methodology mirrors what traditional firms produce manually over 4–6 weeks. It is delivered in a fraction of the time.
Which property types do you publish samples for?
All 13 underlying types plus 2 CPA private-label variants: short-term rental, single-family rental, condo, duplex, triplex, fourplex, multifamily 5+, office, medical office, retail, restaurant, industrial / warehouse, mixed-use, and CPA private-label SFR / STR. Pick the type that matches your property and we'll email you the matching sample report.
Why one report at a time instead of the whole library?
The sample for your property type is the one that's actually useful. Sending the full catalog meant most people read a generic STR report regardless of their property and walked away with the wrong mental model of what their study would look like. The picker matches you to the report that mirrors your situation.
Can I use a sample as a substitute for ordering my own study?
No. Each property's component allocation depends on its specific construction, age, finish level, FF&E, and land improvements. The samples illustrate what your study will look like — they're not portable to another property. A deduction based on a template or copied study can be disallowed at audit.
What's the difference between an example and a sample report?
Practically nothing. Some providers call theirs 'samples' (formal PDF style), others 'examples' (case-study style). Ours are both: the emailed PDFs are full sample studies modeled by our engine on illustrative properties; the worked examples at /examples/cost-segregation-{price}-{type}/ are computed projections from the same engine, in a faster-to-skim format. Use the PDFs to evaluate the deliverable; use the examples to ballpark your numbers.
Who reviews my study?
Every paid report goes through internal technical review & QC. For larger engagements and data-center studies, where a CPA requires a named engineer, a credentialed engineering partner is engaged per engagement under a signed letter and named on the report cover.
What does audit support cover?
Lifetime audit support, included: written answers to your CPA's technical questions about our methodology, for the life of the study — no expiry. It does not include IRS representation. See the full audit-support scope.
What happens with Form 3115?
When a prior-year lookback applies, your report includes the §481(a) catch-up schedule and supporting workpapers, and your CPA prepares, signs, and files Form 3115 with your return. Preparing and signing the form itself is available as a separately engaged, separately priced add-on; filing it, and deciding whether a method change is appropriate, stays with your CPA either way.
Want one for your property? Run your numbers.
Same engineered methodology as the sample reports. Punch in your purchase price to see what your Year-1 deduction looks like.