Sample retail cost segregation report
A real, redacted Cost Seg Smart retail / commercial property study, shown so you can see exactly what the deliverable contains and how the component allocation works. The numbers below come from one illustrative Charlotte, NC example.
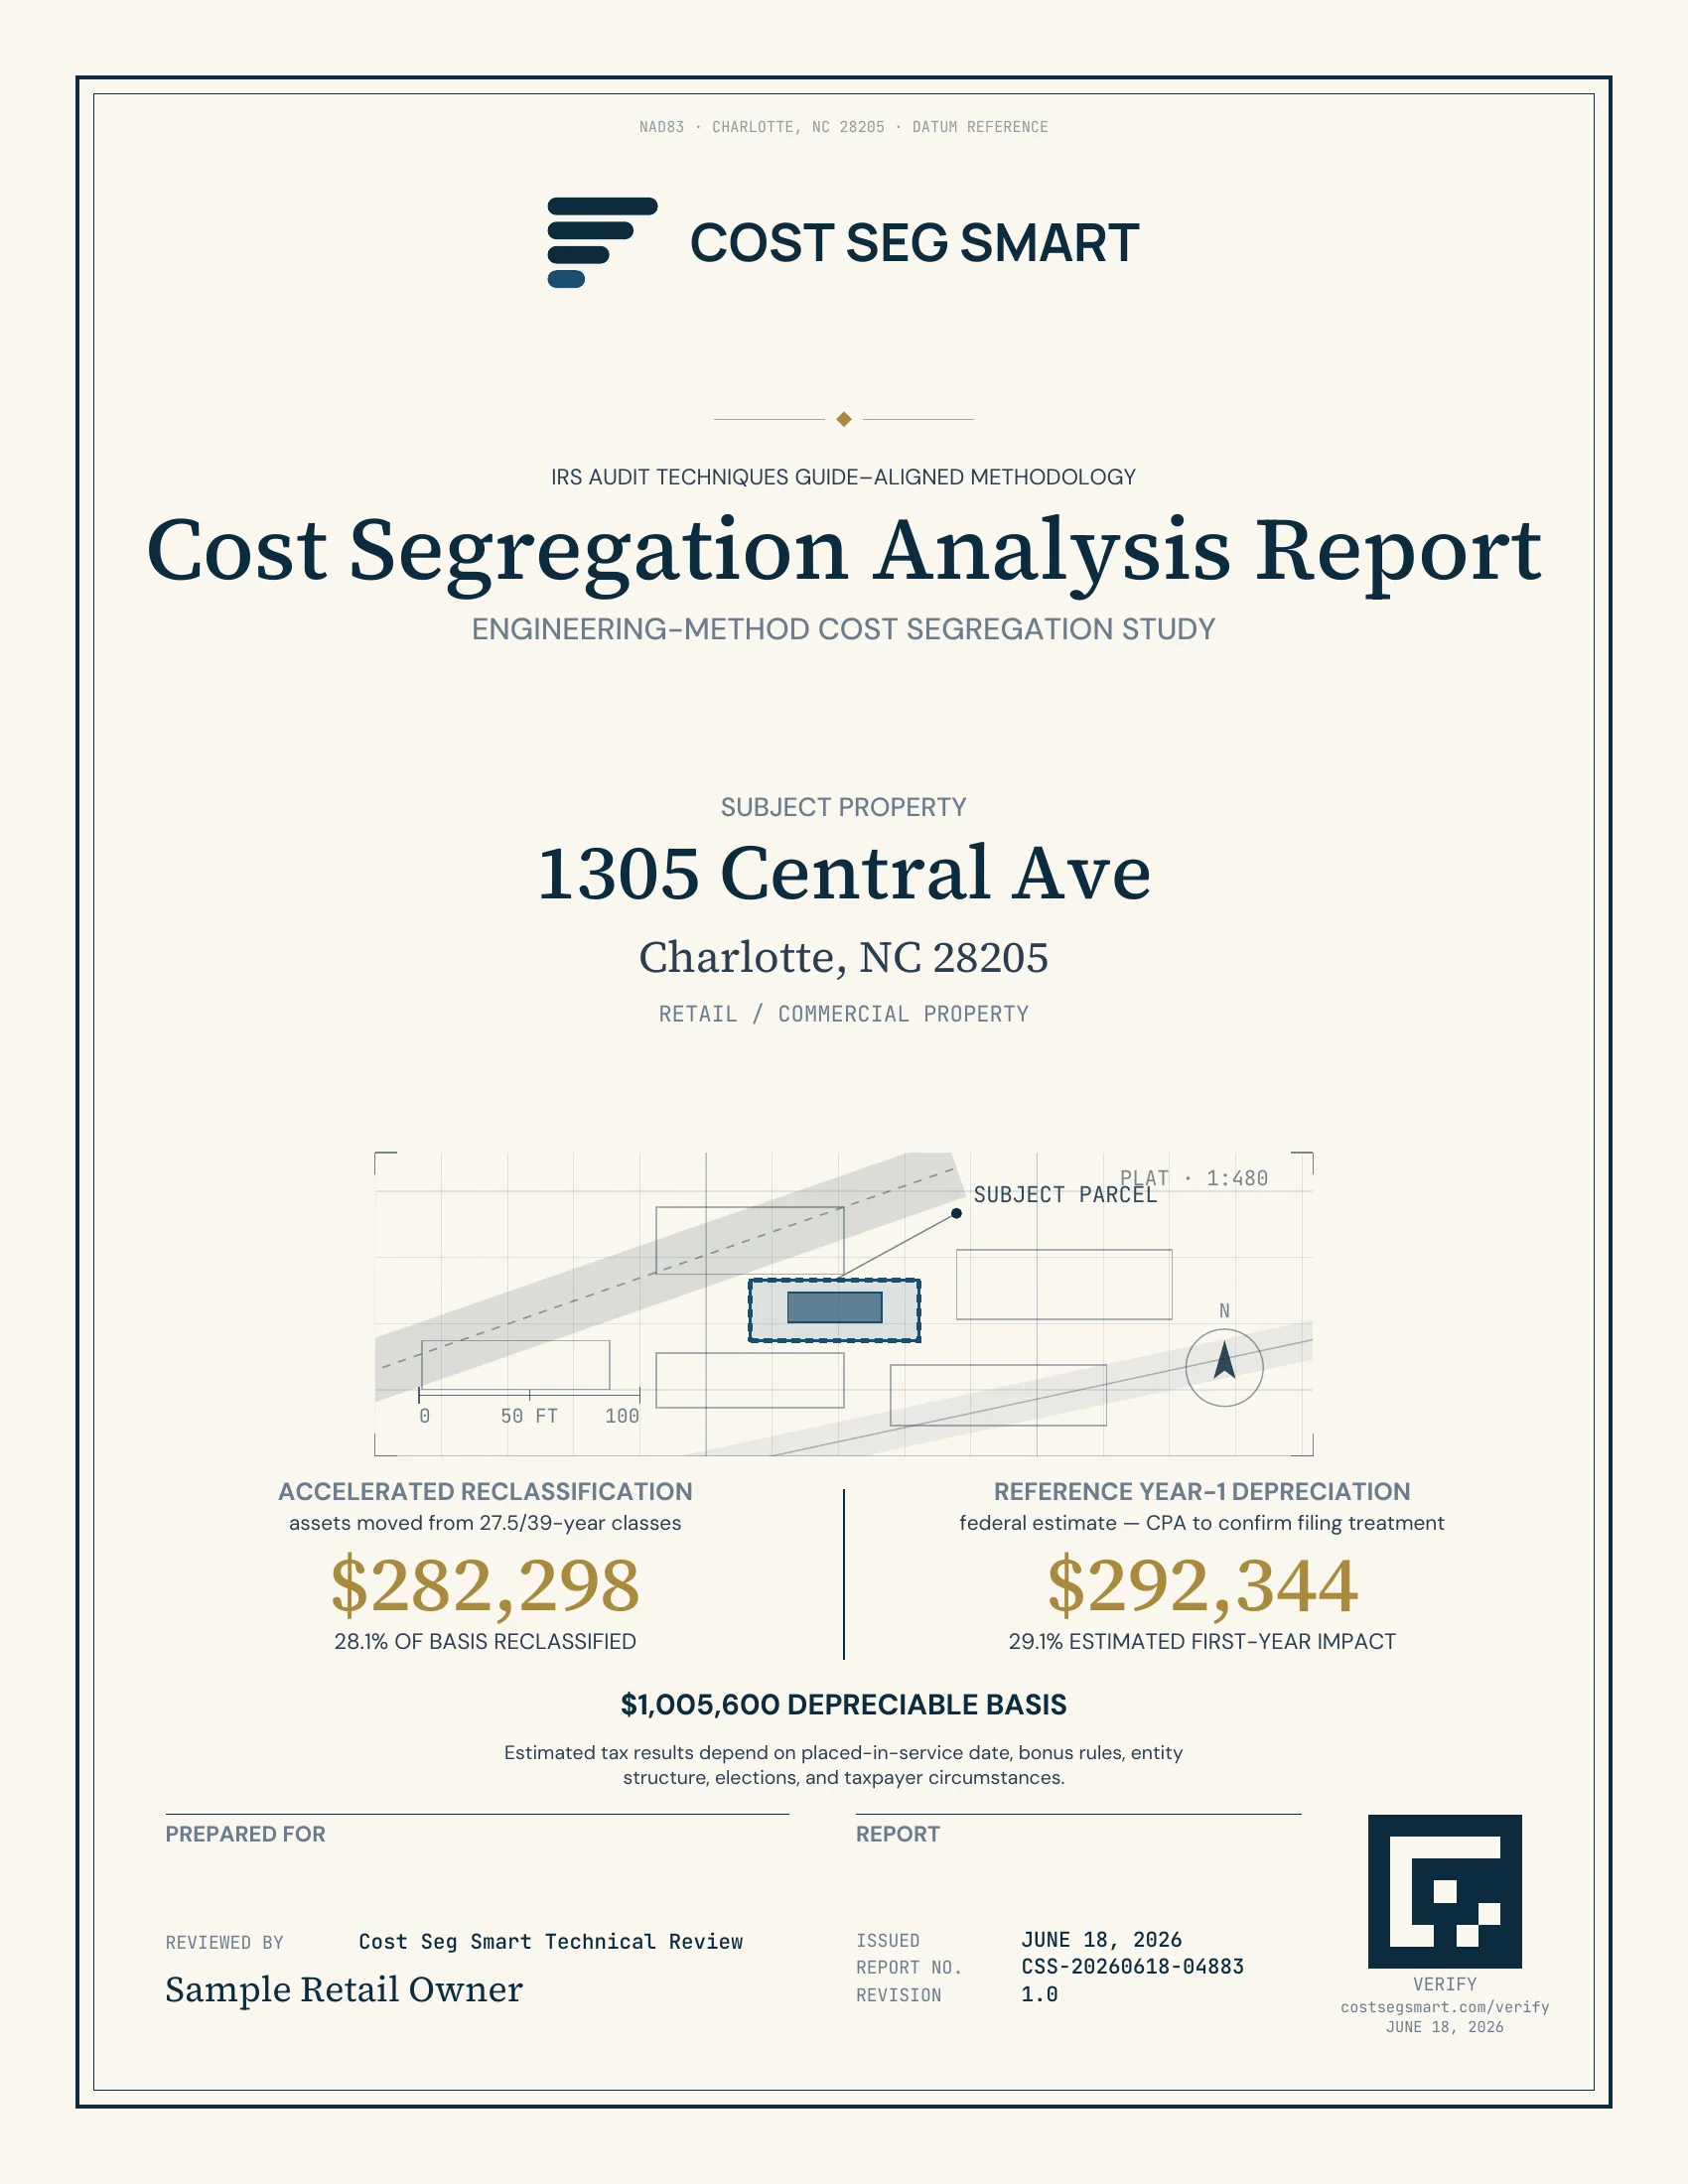
This Charlotte, NC study, by the numbers
One illustrative sample, not a benchmarkIllustrative result from one sample report. Actual reclassification varies substantially with property age, improvements, tenant finish, equipment, land value, and other facts. Not a benchmark or expected range. Request the full sample PDF →
Inside the report: actual pages
Real pages from a retail study (an illustrative Charlotte, NC subject property, figures redacted where needed). This is the actual deliverable, not a brochure mockup. Click any page to open it full size.
The report itself
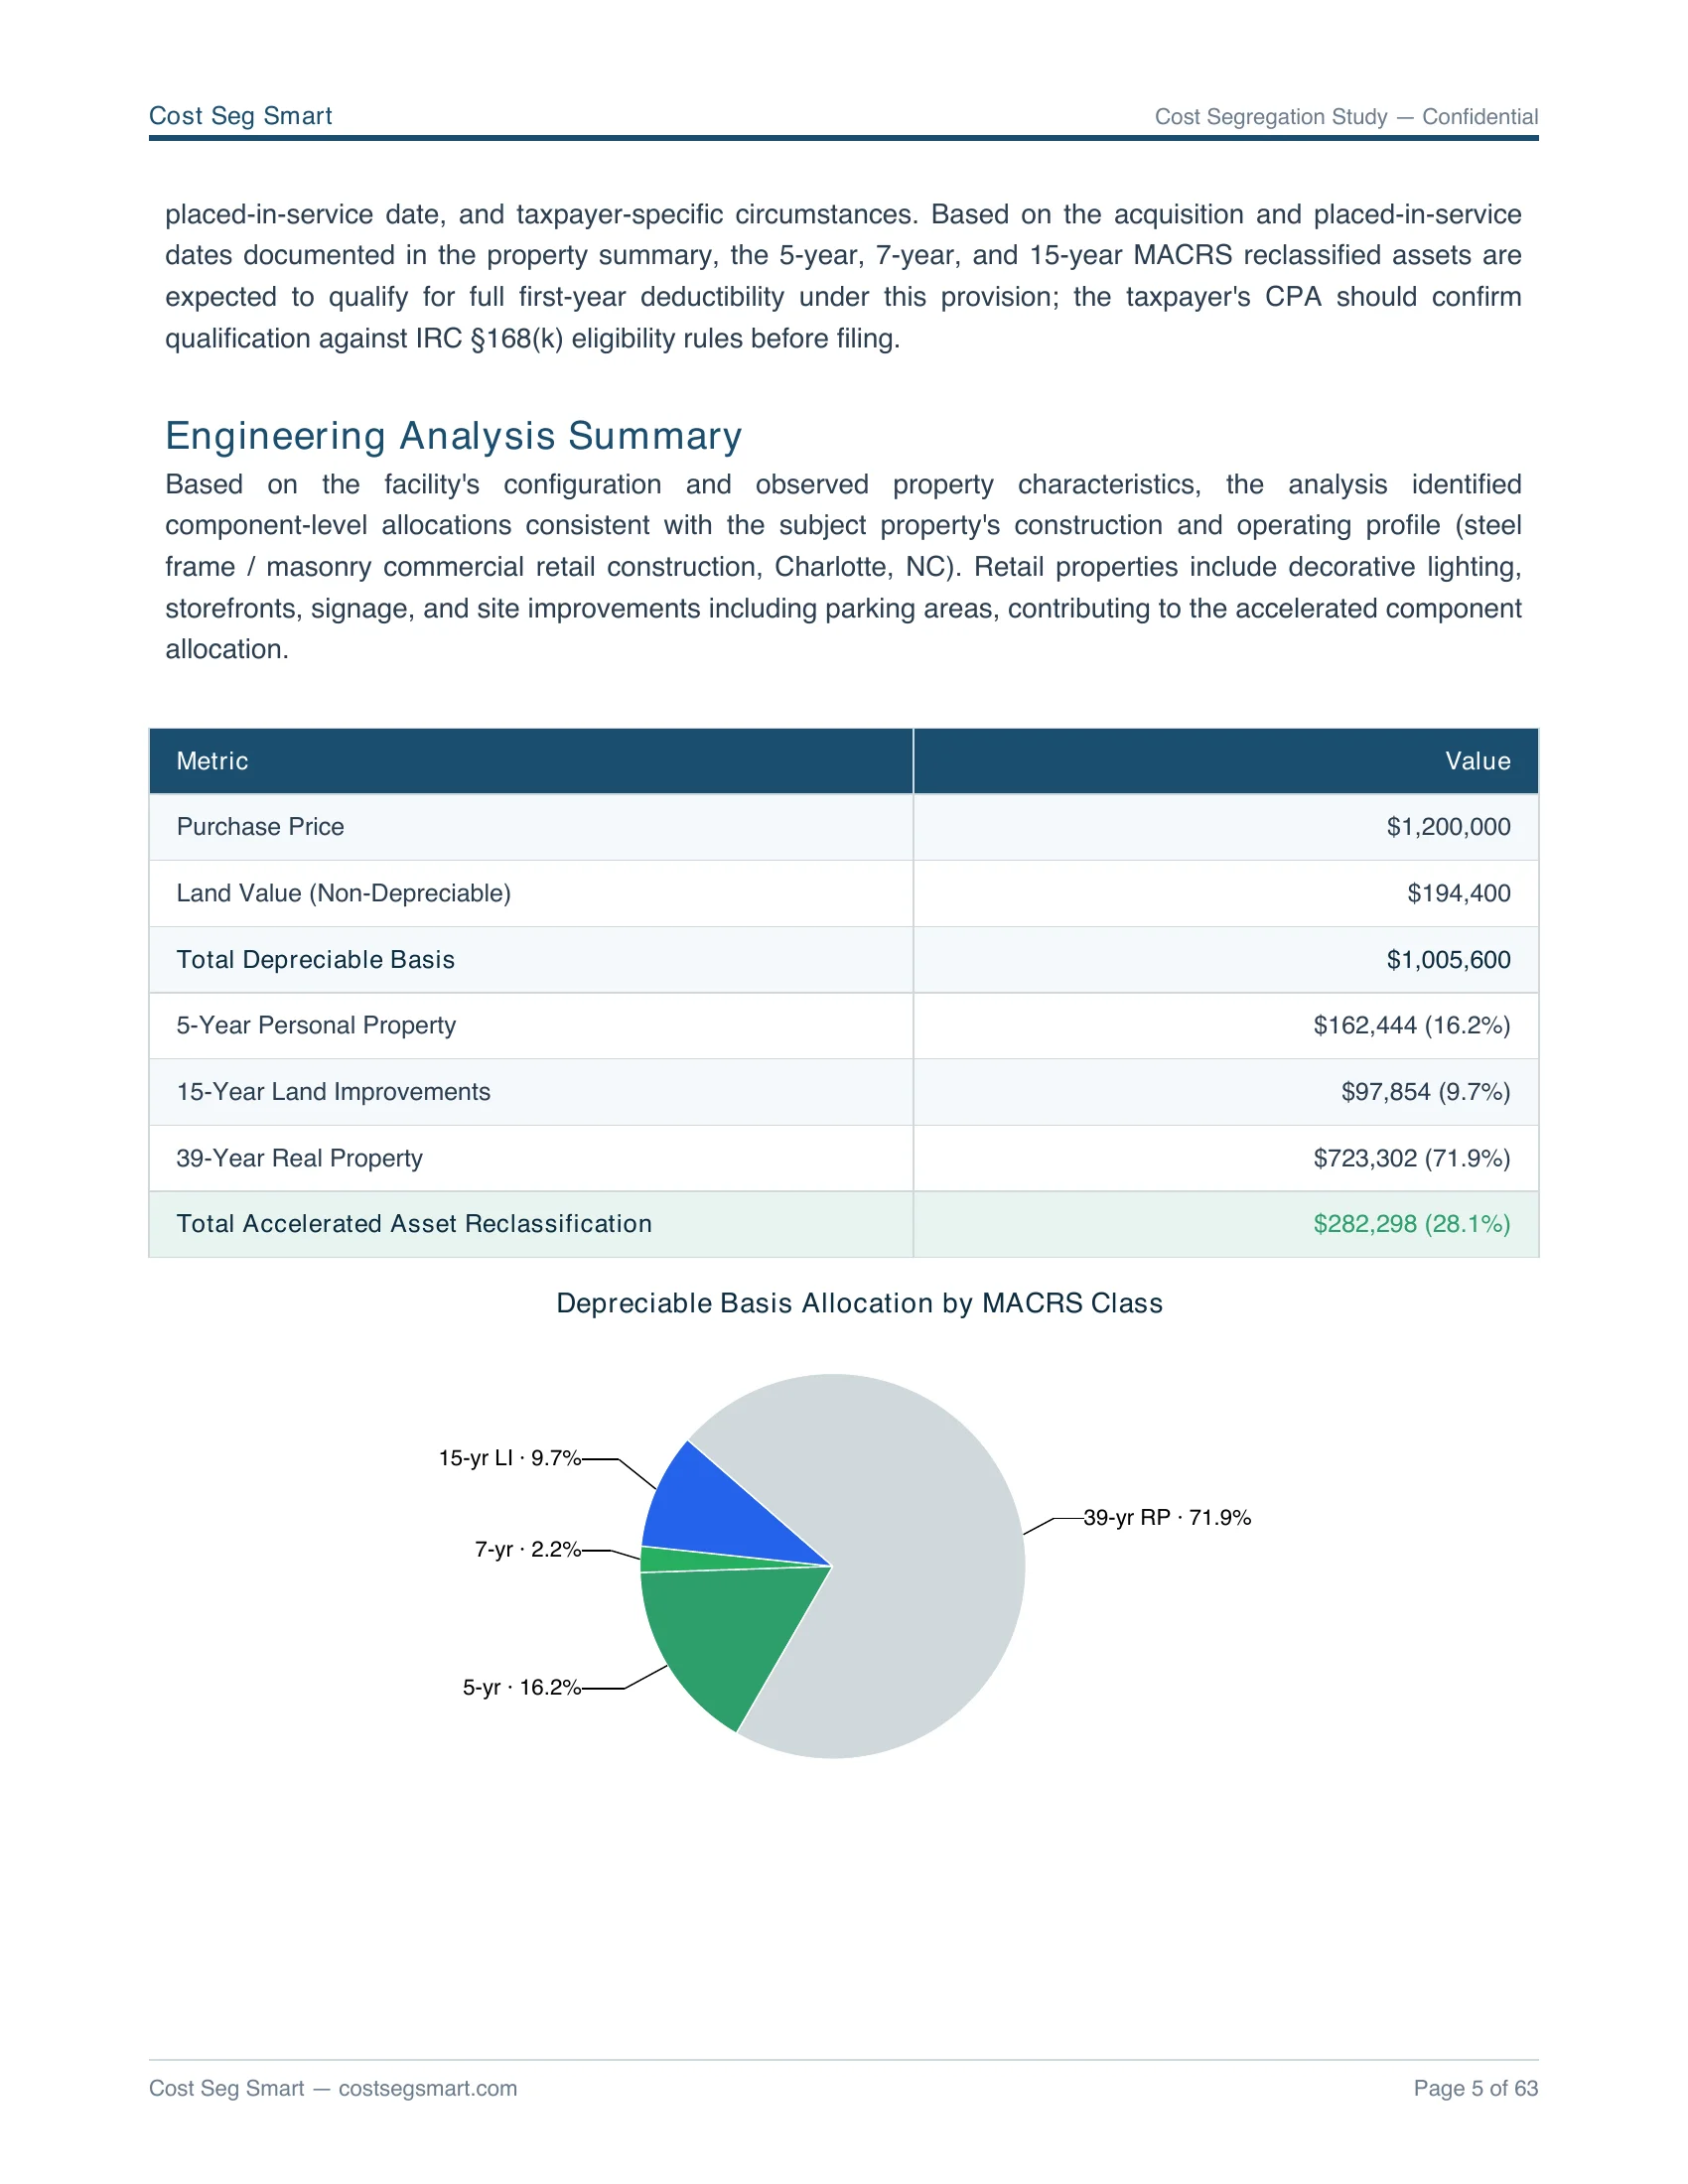
Engineering analysis summary
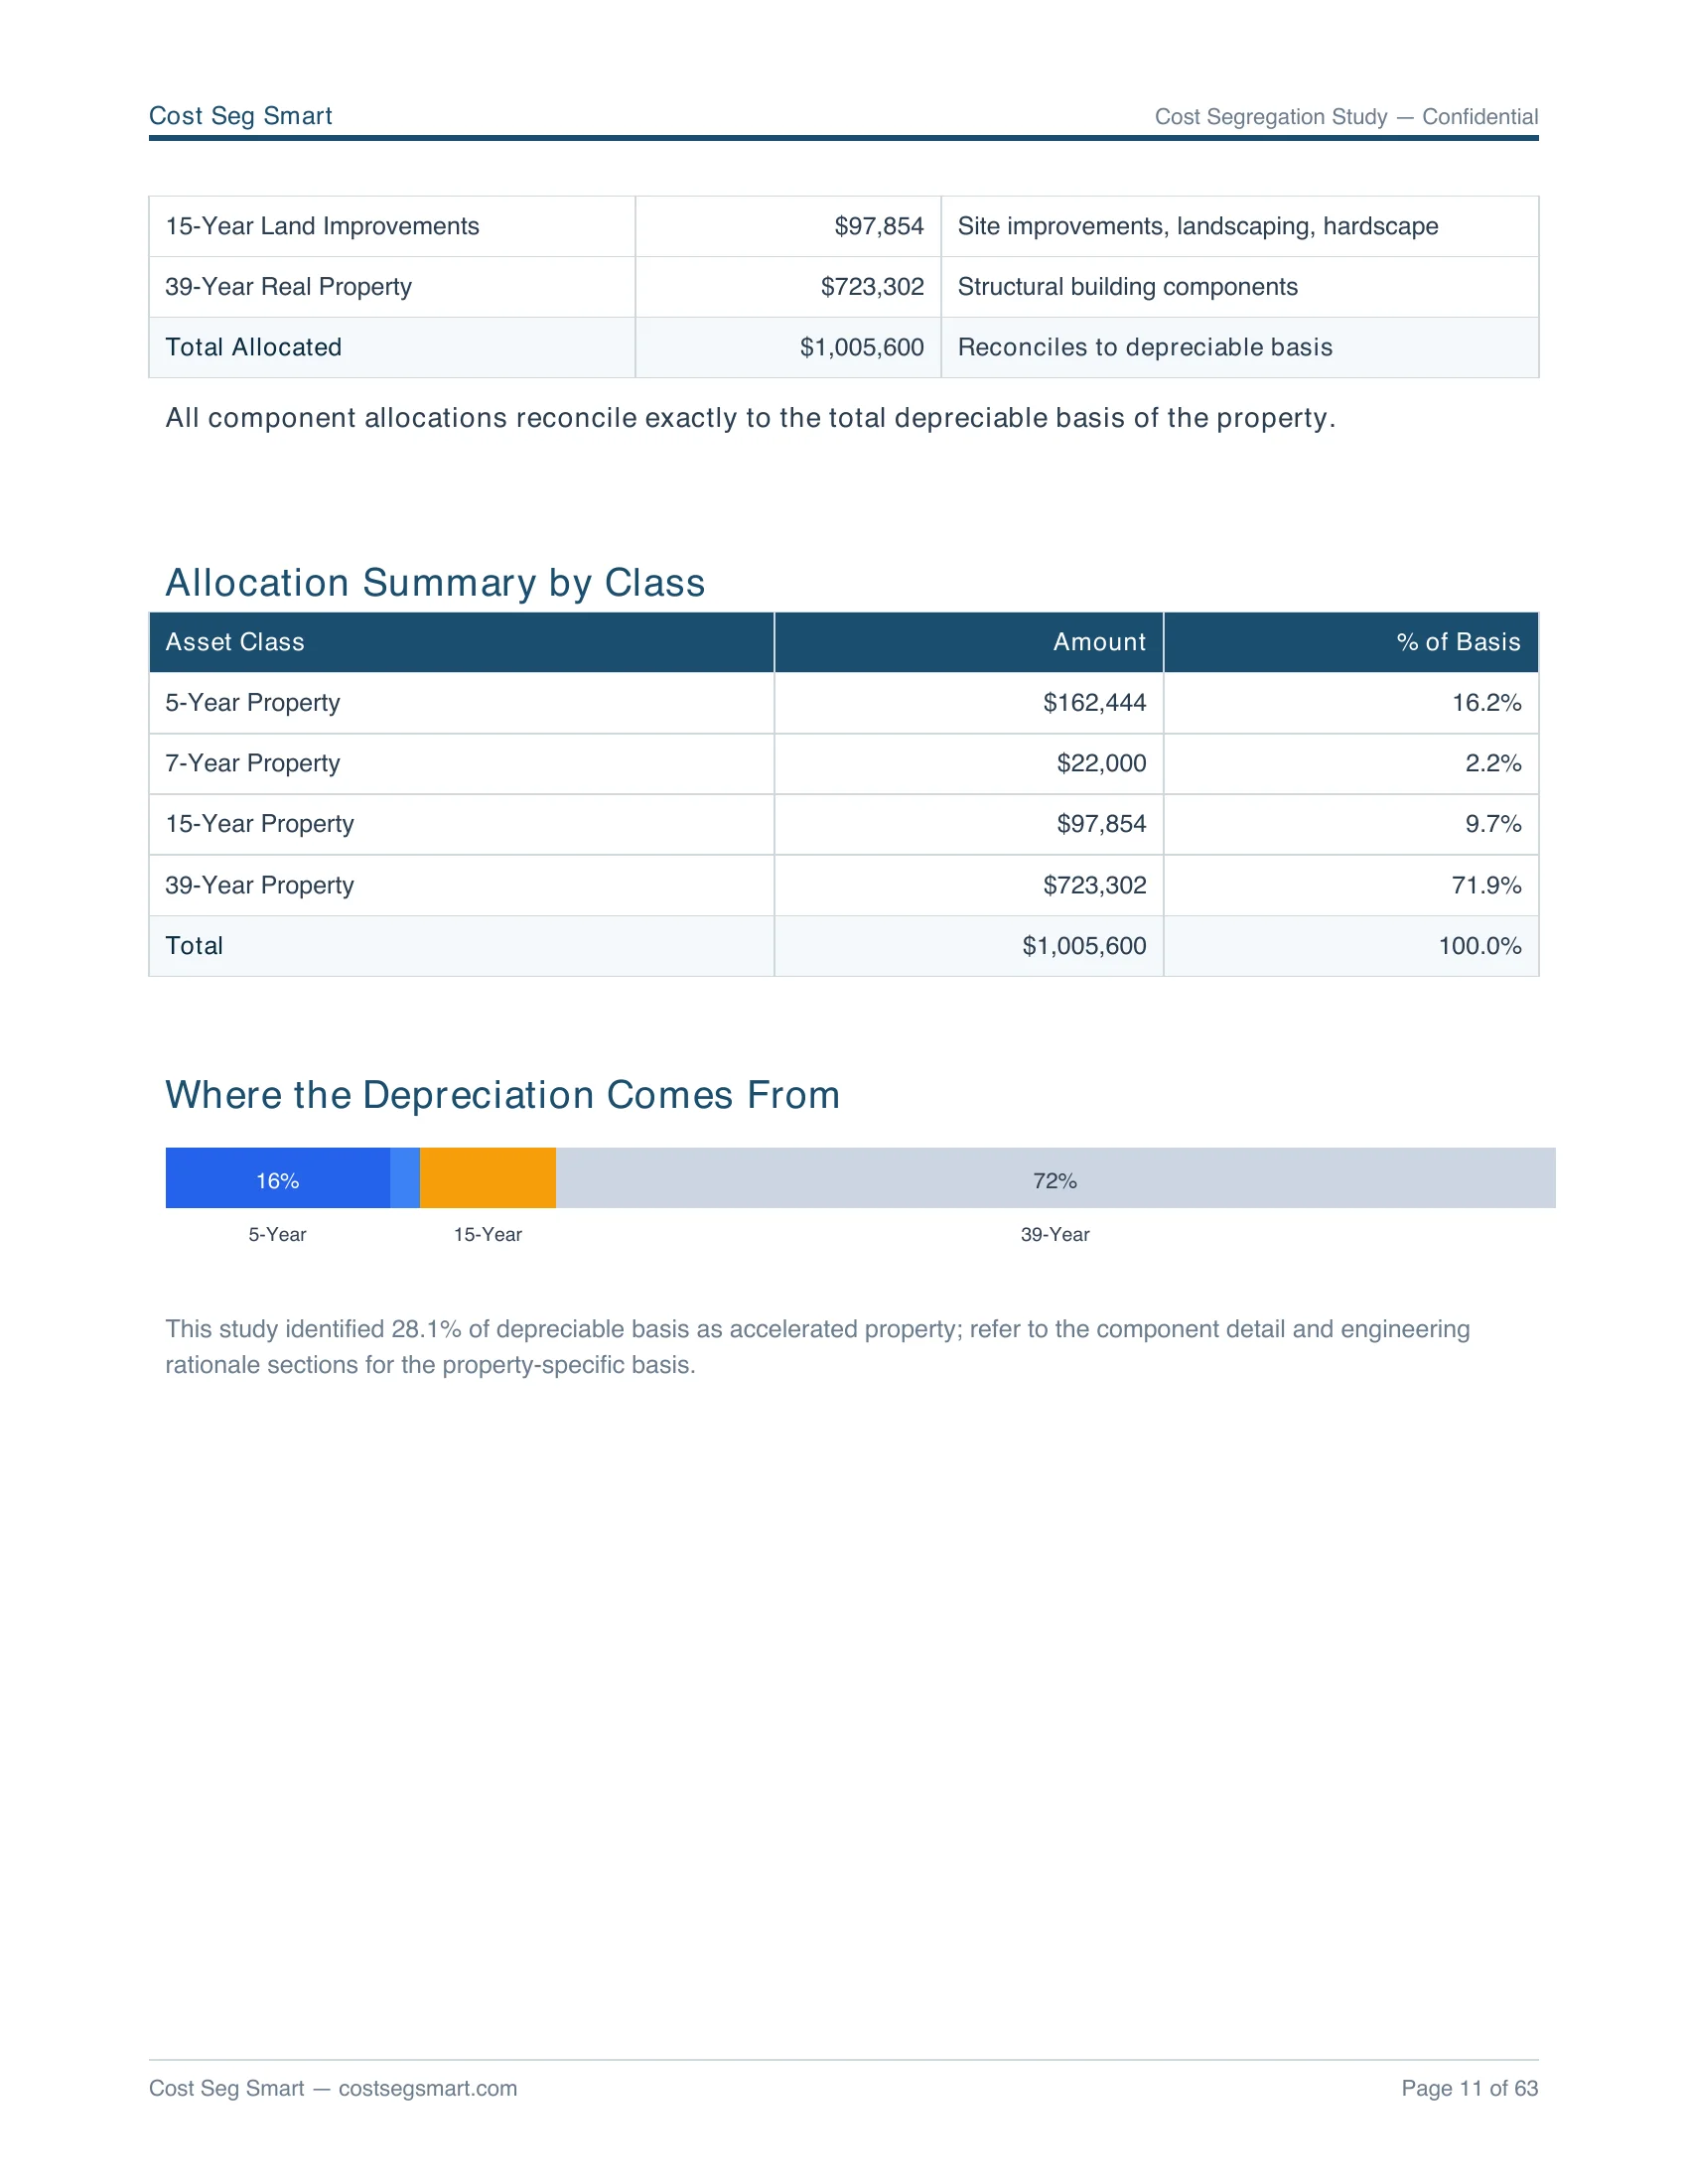
Allocation by asset class
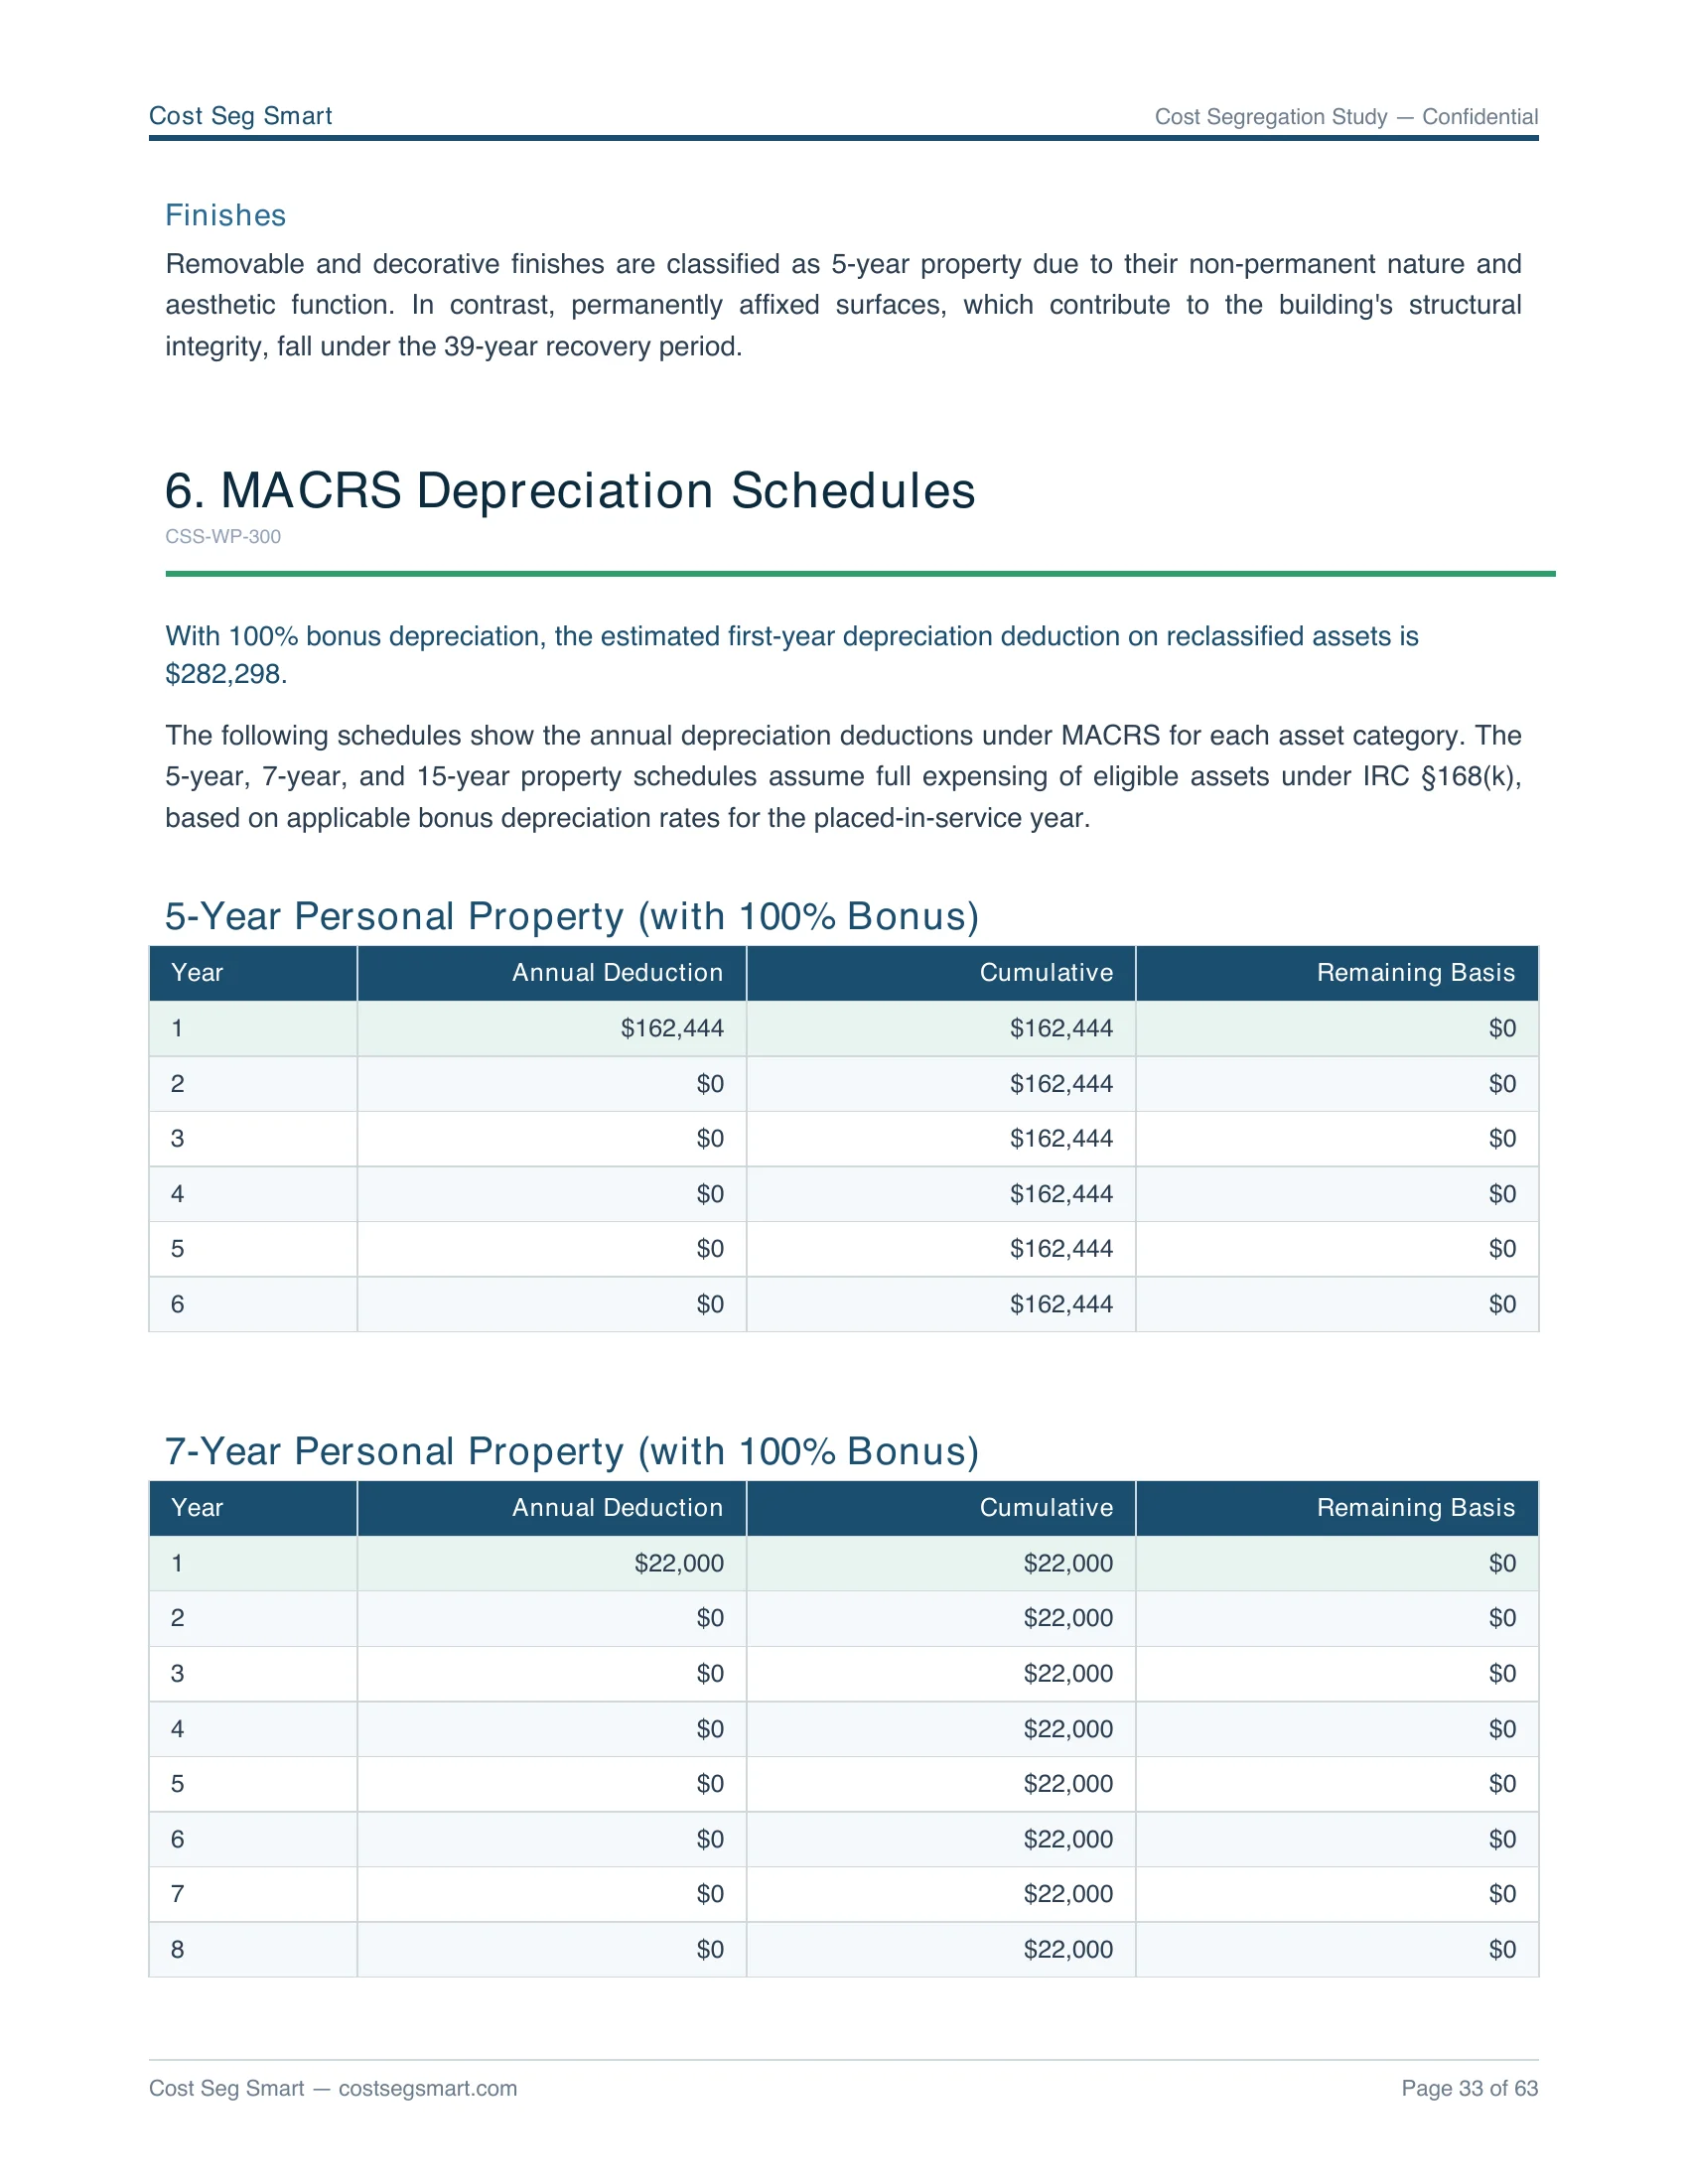
MACRS depreciation schedules
IRS methodology, addressed
Illustrative result from one sample report. Actual reclassification varies substantially with property age, improvements, tenant finish, equipment, land value, and other facts. Not a benchmark or expected range.
Why retail leans on storefront and parking
This illustrative Charlotte retail property reached 28.1%, split between the storefront and a sizable parking lot. Retail buildings frequently contain:
- ✓ Storefront and display fixtures
- ✓ Display and accent lighting
- ✓ Signage and branding elements
- ✓ Decorative interior finishes
- ✓ Parking lot, curbing, and site lighting
- ✓ Landscaping and hardscape
Retail accelerates storefront finishes and display lighting, plus a sizable 15-year parking and site-work bucket. A pad on a large lot reclassifies more than an inline space with shared parking.
Illustrative component allocation
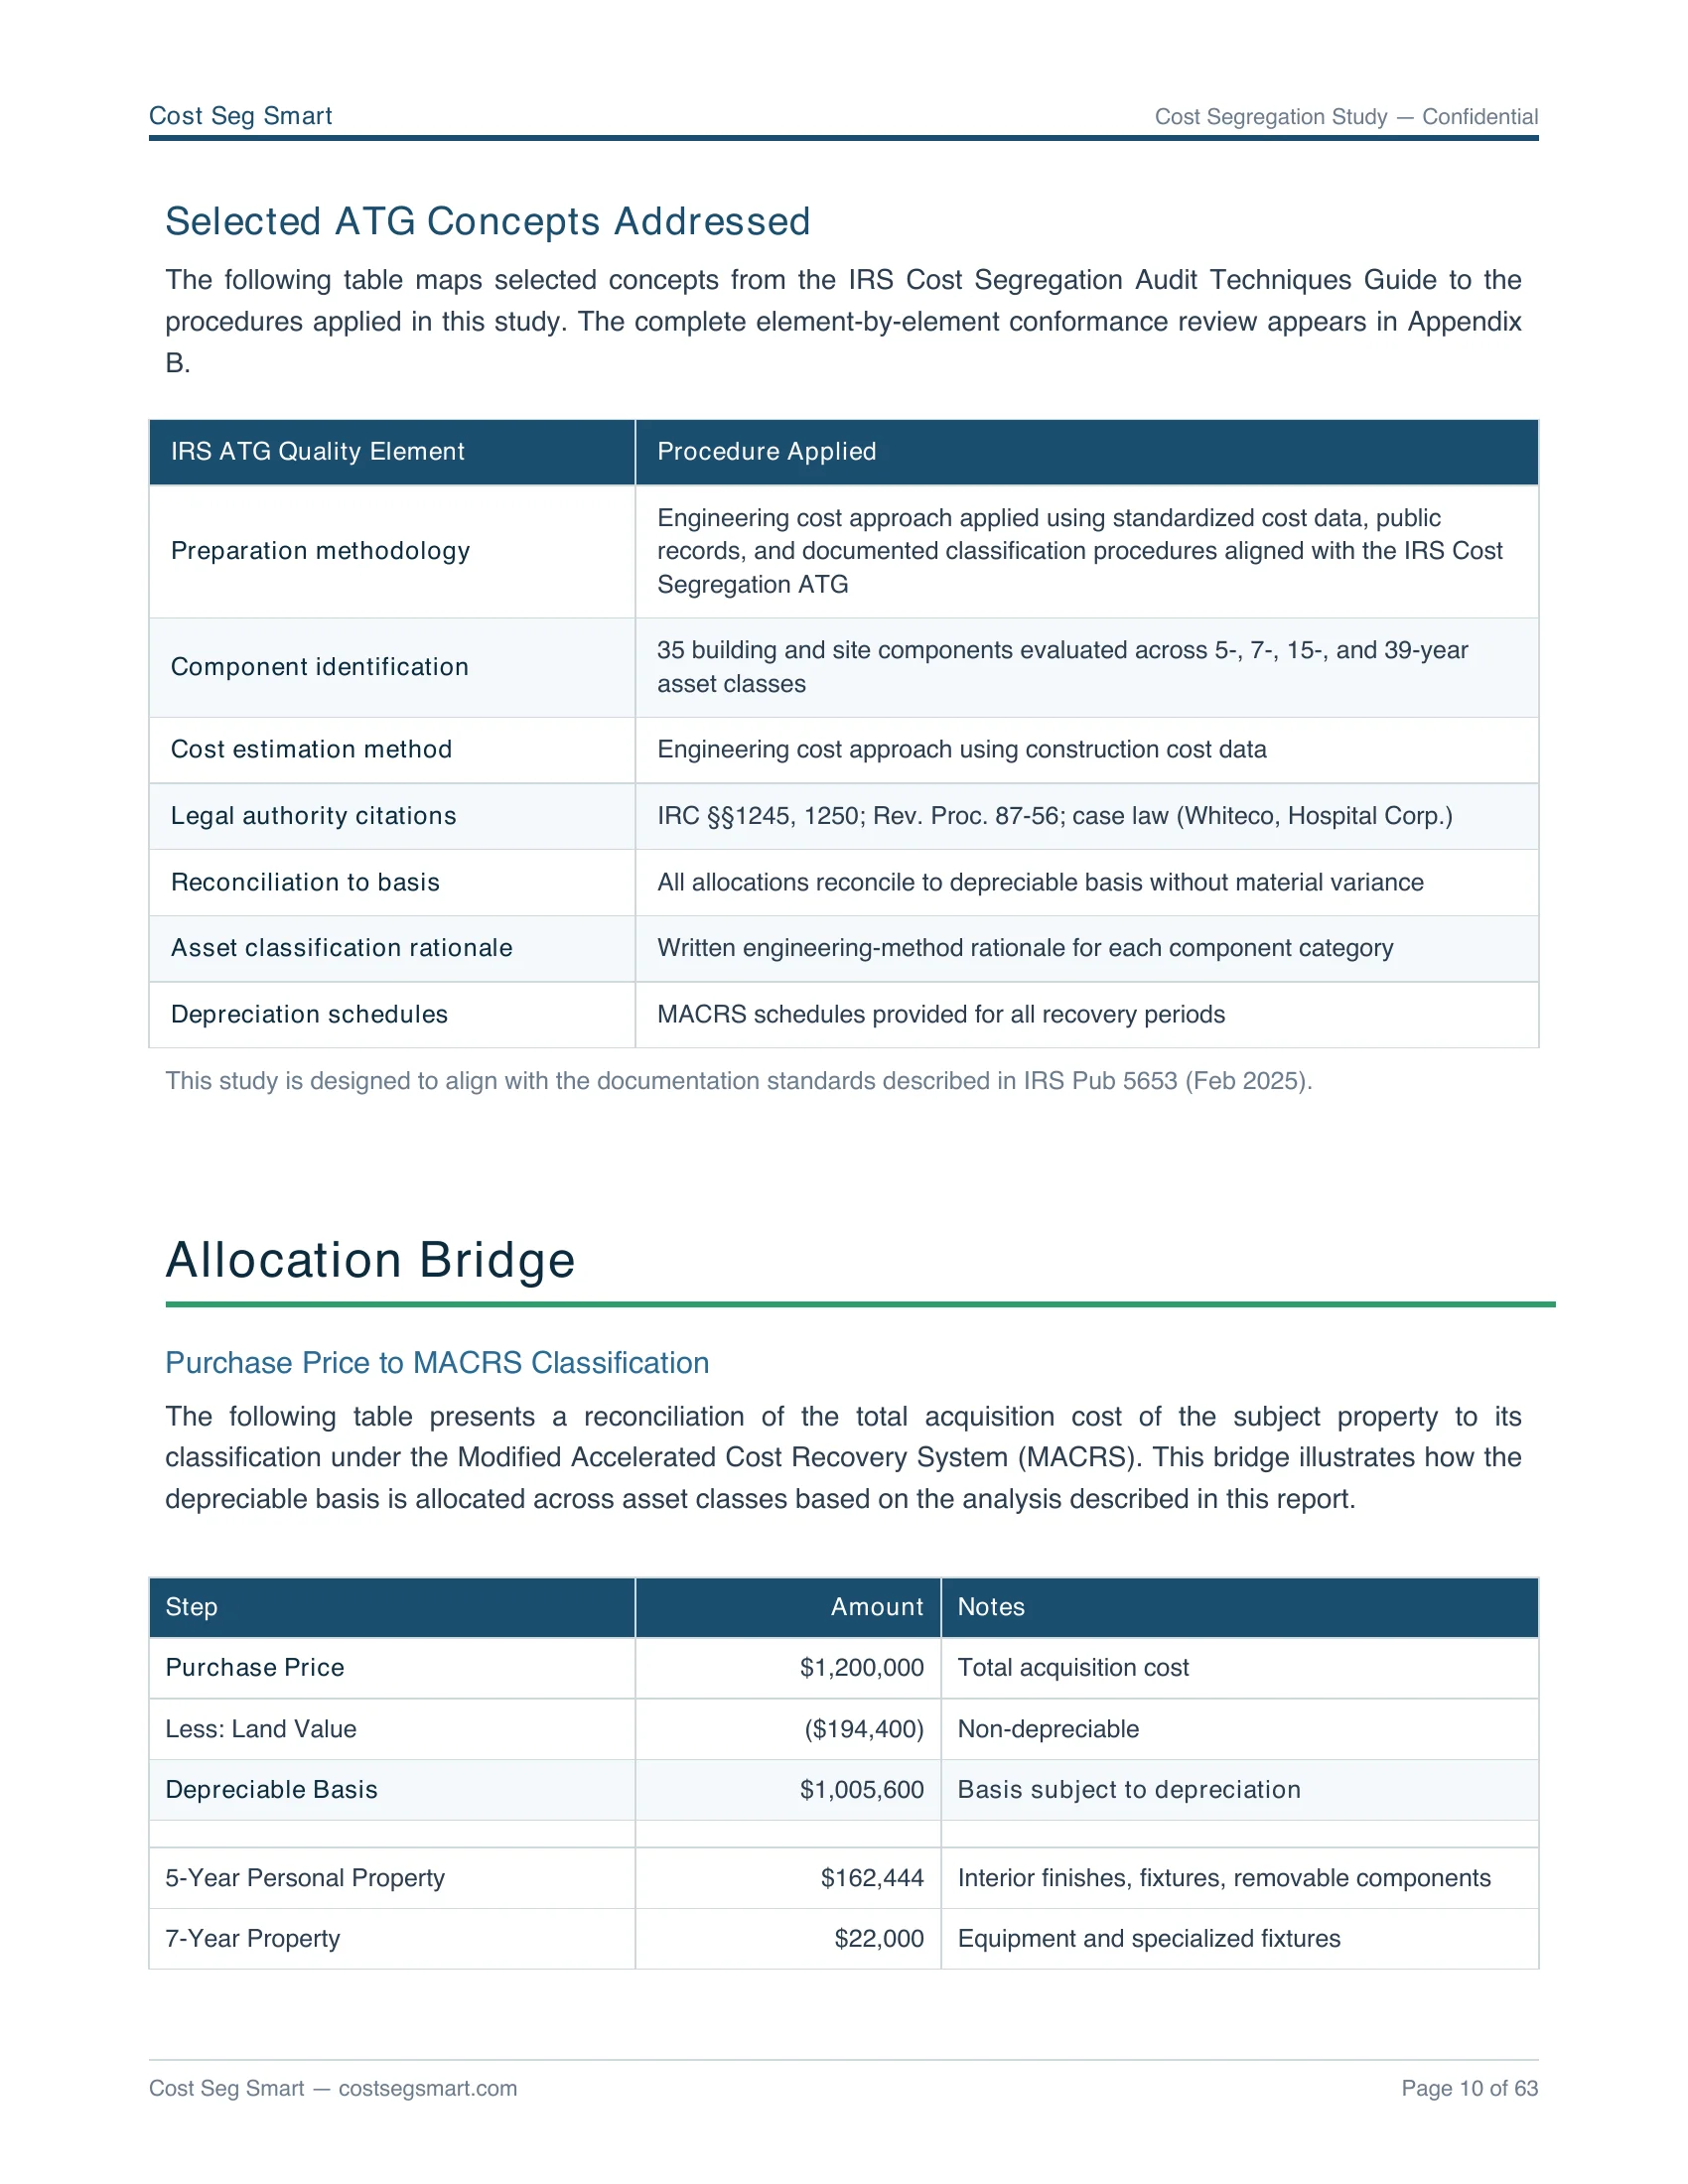
Retail accelerates storefront finishes, display lighting, and a sizable parking/site-work 15-year bucket. Below is how this one sample report split its $1,005,600 depreciable basis across MACRS classes (Section 3 of the deliverable lists every component line by line).
| MACRS class | Allocated basis | % of basis |
|---|---|---|
| 5-Year Personal Property Storefront, display lighting, signage, fixtures | $162,444 | 16.2% |
| 7-Year Personal Property Specialty fixtures and equipment | $22,000 | 2.2% |
| 15-Year Land Improvements Parking lot, curbing, site lighting, landscaping | $97,854 | 9.7% |
| 39-Year Commercial Shell Structural building and base systems | $723,302 | 71.9% |
| Accelerated (5/7/15-year) | $282,298 | 28.1% |
Where the depreciation comes from
Illustrative result from one sample report. Actual reclassification varies substantially with property age, improvements, tenant finish, equipment, land value, and other facts. Not a benchmark or expected range. Tax-side figures assume the placed-in-service year's §168(k) bonus rate and an assumed entity rate; actual depends on entity structure, state conformity, passive-activity limits (§469), and at-risk basis (§465). Verify with your CPA before filing.
Why your result will differ from this example
No two retail properties reclassify the same. The 28.1% above came from one specific building. Yours depends on:
- → Property age — newer buildings carry more reclassifiable finishes and systems.
- → Renovations and tenant improvements — recent build-outs add 5- and 7-year assets.
- → Equipment intensity — equipment-heavy uses (kitchens, service bays, medical) reclassify more.
- → Site work — extensive paving, parking, and landscaping drive the 15-year bucket.
- → Land value — a higher land share leaves less depreciable basis to reclassify.
- → Local construction costs and finish level — these shift each component's allocated basis.
That is why we model your specific property before you commit, and never apply a rule-of-thumb percentage. The IRS Cost Segregation Audit Techniques Guide (Pub 5653) warns against template and rule-of-thumb studies for exactly this reason.
Why CPAs file straight from these reports
Every retail study delivers the same six-section structure, so your CPA can file without rework. Depth scales with property size and lookback complexity.
Executive summary
The one-page summary your CPA reads first: total reclassified, the Year-1 deduction, and the technical-review sign-off.
Engineering methodology
Shows why each asset was assigned its depreciation class, and documents the reasoning behind every allocation.
Component allocation tables
Every component (typically 40 to 80 line items) mapped to its asset class and MACRS life, with subtotals that reconcile to the depreciable basis.
Depreciation schedules
Year-by-year MACRS deduction tables, formatted to drop straight onto Form 4562, with bonus depreciation flagged for the placed-in-service year.
Section 481(a) lookback workpaper
For a Form 3115 catch-up: the cumulative Section 481(a) adjustment and a line-by-line reference for your tax preparer (when applicable).
Documentation and audit support
A cost-source citation for every component, the classification rationale, and a ready-made response pack for examiner questions. 36 months of support included.
How the report addresses IRS examiner standards
The IRS Cost Segregation Audit Techniques Guide (Pub 5653) lists the elements an examiner reviews, and the report maps to each one: the engineering methodology and component allocation document every classification, each component carries a Rev. Proc. 87-56 asset-class citation with its rationale, and the final section supplies a ready-made examiner-question response pack.
Every study includes 36 months of audit support at no additional charge. Full scope at /audit-defense/.
How this compares with traditional firms
Traditional-firm figures are typical industry ranges; confirm pricing and scope directly with any vendor. For the full firm-by-firm breakdown see best cost segregation companies.
Report questions
Is this a real retail cost segregation report?
What reclassification percentage should I expect for a retail?
Can I download the sample PDF?
Does the report include Form 3115 for a lookback?
How is this different from a benchmark or a percentage range?
See your retail's real numbers, not a sample's.
We model your specific property before you pay. Order an engineered study or request the full illustrative retail sample PDF first.
Estimate your retail savings · All report examples · Retail cost segregation · Form 3115 walkthrough · Audit defense