STR Cost Segregation Benchmarks by U.S. Market, 2026
What a cost segregation study produces for a furnished short-term rental in 24 U.S. markets, from the same engine run against 120 modeled scenarios. First-year deduction and its value at the assumed rate, reclassification share, land allocation, and how each state treats the federal acceleration. Free to cite under CC-BY 4.0.
- Markets
- 24
- Modeled scenarios
- 120
- Median first-year deduction
- $135,853
- Its value at 37%
- $50,266
- Median reclassified
- 26.7%
What the data shows
The same study produces a 8.2× spread in first-year deduction across markets
The methodology does not change from market to market. The engine identifies the same component classes, applies the same MACRS rules and the same 100% bonus rate everywhere. What changes is the property it is pointed at and what that property contains. The market medians run from a first-year deduction of $50,947 in Chicago to $418,487 on 30A, with the all-market median at $135,853. At an assumed 37% federal rate those are worth $18,850, $154,840 and $50,266.
Read the whiskers, not only the bars. Several markets have an interquartile range wider than the gap between their median and the next market's, which is the honest shape of the result: a market sets the neighbourhood of the answer, and the specific property picks the point inside it.
Horizontal bar chart of the median first-year deduction for all 24 markets, ranked from 30A at $418,487 down to Chicago at $50,947, with an interquartile-range whisker on each bar and the value at 37% beneath each label. Short-term-rental-led markets fill the top of the chart; metro long-term-rental markets fill the bottom. The same values appear in the full table below.
Purchase price alone does not explain the result. Three markets share one median price and land 2.3× apart
Breckenridge, Maui and Los Angeles all carry a median modeled purchase price of $1,325,000. Their median first-year deductions are $231,779, $197,546 and $102,747. Same price, same engine, same federal law.
Two things separate them. The Breckenridge scenarios are furnished short-term rentals assumed to carry a hot tub, deck, fire pit and media room; the Los Angeles scenarios are unfurnished long-term rentals, so far less of their basis sits in short-life property. And on Maui, 45.0% of the median price is land, against 25.2% in Breckenridge. Land is never depreciated, so the study starts from a smaller building basis before a single component is classified.
Scatter plot of median modeled purchase price against median first-year deduction for all 24 markets. Short-term-rental-led markets sit above metro markets at every price. Breckenridge, Maui and Los Angeles share the same horizontal position and are spread vertically.
Reclassification share tracks what the scenarios assume the property contains, and the two groups do not overlap
Across the 16 short-term-rental-led markets, the lowest market median for the share of depreciable basis reclassified into 5-, 7- and 15-year property is 25.6%. Across the 8 metro markets, the highest is 15.9%. There is no overlap. The all-market median is 26.7%, with an interquartile range of 15.4% to 30.8%.
Read this as a property of the scenarios, not as a market survey. The STR scenarios are defined as furnished rentals, so they carry appliances, cabinetry, flooring, decking and outdoor amenities that the model assigns to 5-, 7- and 15-year recovery periods; the metro scenarios are defined as unfurnished long-term rentals that are mostly structure, and structure stays at 27.5 years. The gap in the chart is what those input definitions produce. It says nothing about matched real properties, and an unfurnished house in a resort market would land with the metro group.
Dot plot of the median share of depreciable basis reclassified for each market, grouped by cohort, with an interquartile-range bar behind each dot. Every short-term-rental cohort sits between roughly 26% and 38%; the two metro cohorts sit near 16%. A dashed line marks the all-market median of 26.7%.
Land allocation is the swing variable, and it runs from 14.0% to 50.0%
The median land share across the dataset is 24.7%, but the market medians run from 14.0% in Broken Bow to 50.0% on Park City. Reclassification share is a percentage of the building, so two markets with the same reclassification rate and the same price can deliver very different dollar results once land is taken out.
The engine reads county assessor records for the land split where the reliability gate passes and applies a premium land floor where the reconciliation factor indicates land-dominant value. Neither is a judgement call at study time. In this dataset the floor binds on the resort-condo and dense-metro scenarios, which is why several high-priced markets (Park City, Maui, Los Angeles, Seattle) carry land shares at or above 39% and rank below markets that cost far less.
Scatter plot of median land allocation against median reclassification share for all 24 markets. The STR-led markets form a band near 27% reclassified across land shares from 14% to 50%; the metro markets form a lower band near 16%.
In 12 of 24 markets the state return does not see the first-year acceleration
The study itself is federal. Component identification, MACRS classification and the bonus election are governed by federal law and are identical in every state. What differs is whether the state income tax return follows. 9 markets are in states with no income tax, where the federal result is the whole story. 3 are in states that conform to federal bonus depreciation, so the first-year deduction reaches both returns. 12 are in states that have decoupled or partially decoupled, where the state-side benefit is spread back over the regular schedule. The federal figures on this page are unaffected. The after-tax total is not.
Grid-tile map of the United States. States containing a market in the dataset are shaded by how the state treats federal bonus depreciation: no state income tax, conforming, or decoupled. Each shaded tile carries the number of dataset markets in that state.
| State position | Markets | Which | States | What it means for the after-tax total |
|---|---|---|---|---|
| No state income tax | 9 | Seattle, Dallas, Houston, 30A, Destin, Naples, Las Vegas, Gatlinburg, Pigeon Forge | FL, NV, TN, TX, WA | Federal bonus depreciation is the entire story. Cleanest possible position. |
| Conforms to federal bonus | 3 | Denver, Park City, Breckenridge | CO, UT | The first-year acceleration flows through to the state return without an addback. |
| Decoupled or partial | 12 | Los Angeles, New York City, Charlotte, Chicago, Maui, Sedona, Tahoe, Broken Bow, Asheville, Bozeman, Big Bear, Savannah | AZ, CA, GA, HI, IL, MT, NC, NY, OK | Federal first-year acceleration captures; the state-side benefit is partly or fully deferred over the regular schedule. |
Tahoe spans two states and is classified by its CA shore (Decoupled / partial, CA up to 13.3% (south + west shore) · NV 0% (north + east shore)). Verify with your CPA. State conformity to federal §168(k) is revised often; several states have changed position more than once in the past decade. Positions here are as of the publication date.
The five markets with the largest modeled deduction
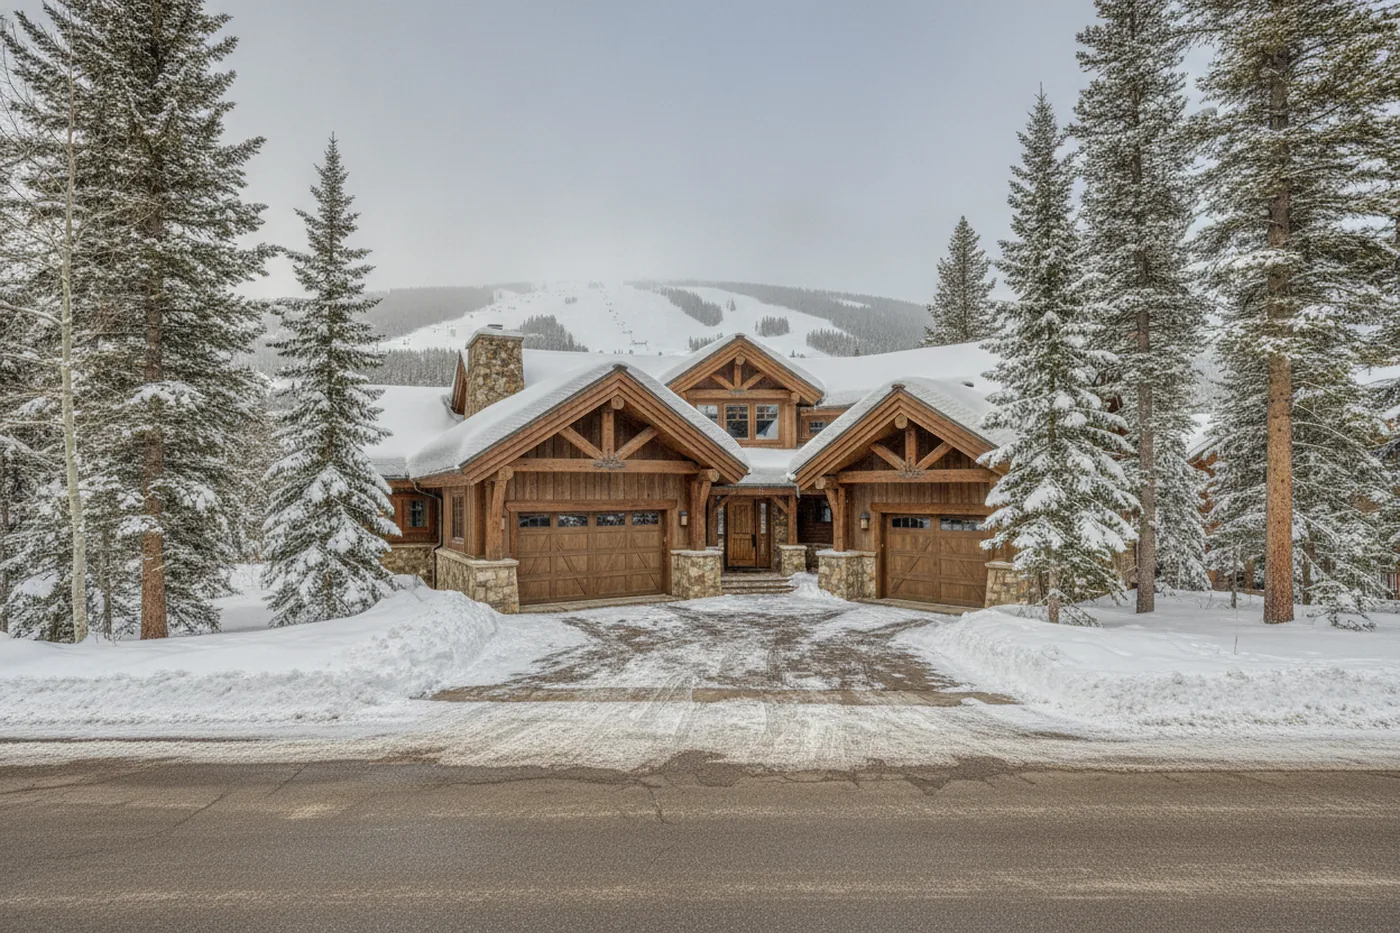
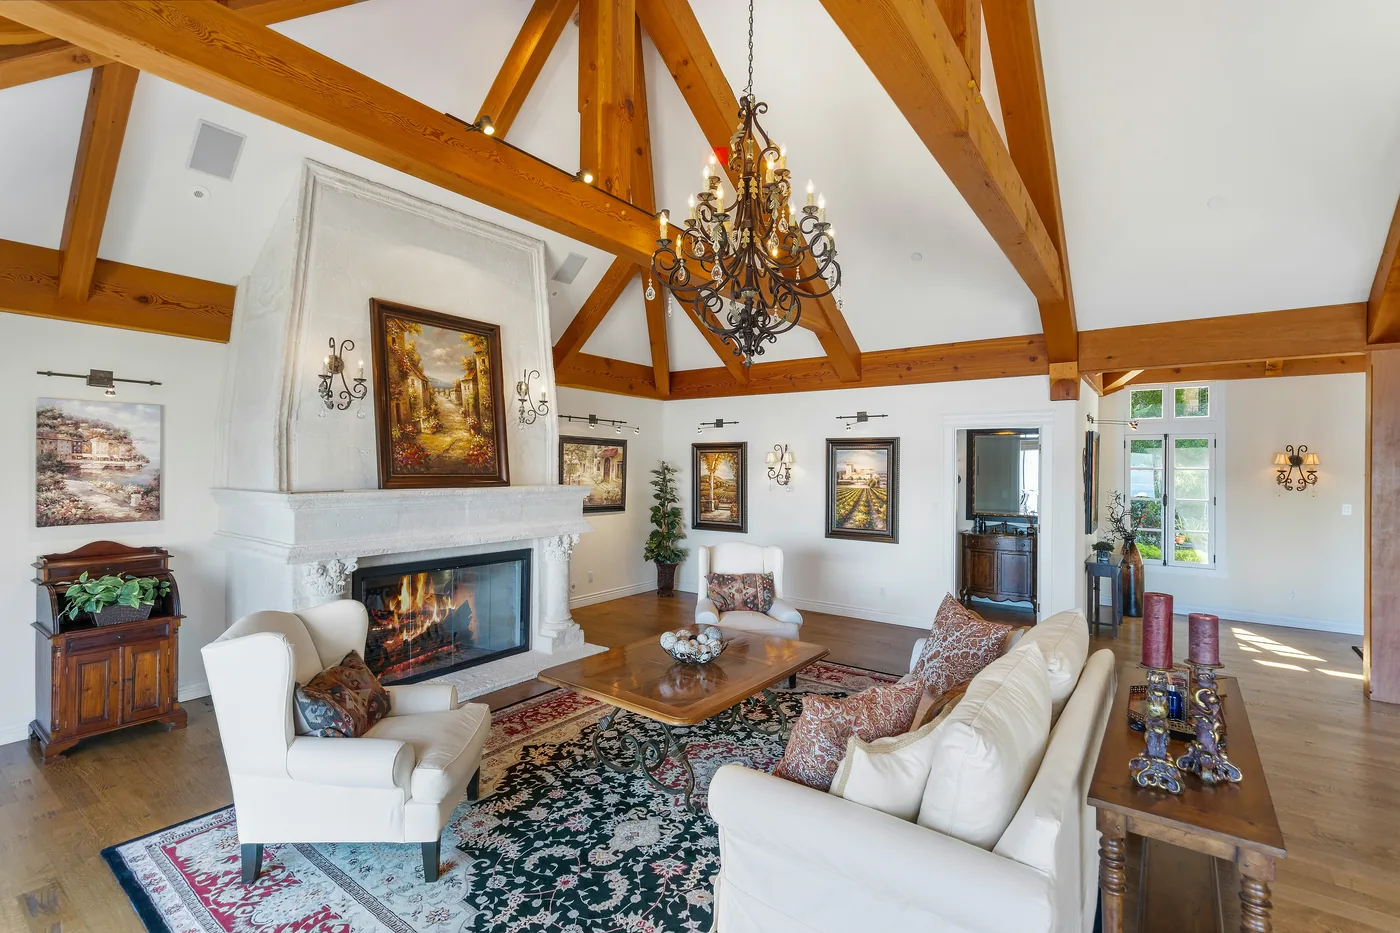
Ranked by median first-year deduction. Park City, Bozeman, Sedona are photographs of the market; 30A and Breckenridge are illustrative renderings, since we do not hold a photograph of either. None shows a property in the dataset.
 1
1 30A, FL Coastal STR
- Median first-year deduction
- $418,487
- Its value at 37%
- $154,840
- Deduction, interquartile range
- $265K to $459K
- Deduction, full range
- $100K to $591K
- Reclassified
- 37.7%
- Land allocation
- 25.2%
- Median modeled price
- $1,485,000
- State tax
- No state income tax
Luxury beachfront single-family inventory along the Rosemary Beach and Seaside corridor, furnished for the rental market and sold in a state with no income tax. It leads every aggregate in this dataset and is the easiest number to anchor on wrongly: the range across its five modeled properties is the widest at the top end.
Assumed in every 30A short-term-rental scenario: upgraded appliances, deck or patio, fencing, built-in grill, hot tub, landscaping, conveyed washer and dryer, network equipment, security system, smart-home controls, structured cabling. Scenarios at or above the market median price also assume fire pit, outdoor kitchen, pool, screen enclosure.
 2
2 Park City, UT Mountain ski STR
- Median first-year deduction
- $280,283
- Its value at 37%
- $103,705
- Deduction, interquartile range
- $169K to $289K
- Deduction, full range
- $116K to $314K
- Reclassified
- 27.9%
- Land allocation
- 50.0%
- Median modeled price
- $1,450,000
- State tax
- Conforms to federal bonus
Deer Valley and Old Town inventory at a similar price point to Breckenridge. Utah conforms to the federal position. Half of the median price is land here, the highest share in the top five, so the deduction comes from an unusually rich mix inside a smaller building basis.
Assumed in every Park City short-term-rental scenario: upgraded appliances, conveyed washer and dryer, network equipment, smart-home controls, structured cabling. Scenarios at or above the market median price also assume deck or patio, exterior fireplace, fire pit, garage, media room, hot tub, landscaping, security system.
 3
3 Breckenridge, CO Mountain ski STR
- Median first-year deduction
- $231,779
- Its value at 37%
- $85,758
- Deduction, interquartile range
- $227K to $280K
- Deduction, full range
- $100K to $301K
- Reclassified
- 26.2%
- Land allocation
- 25.2%
- Median modeled price
- $1,325,000
- State tax
- Conforms to federal bonus
Ski-in, ski-out chalets around Peak 8 carry the furnishings and finish level that push 5- and 7-year property up. Colorado conforms to federal bonus depreciation at a flat rate, so the first-year acceleration also reaches the state return.
Assumed in every Breckenridge short-term-rental scenario: upgraded appliances, hot tub, conveyed washer and dryer, network equipment, smart-home controls, structured cabling. Scenarios at or above the market median price also assume deck or patio, exterior fireplace, fire pit, garage, media room, landscaping, security system.
 4
4 Bozeman, MT Mountain ski STR
- Median first-year deduction
- $219,397
- Its value at 37%
- $81,177
- Deduction, interquartile range
- $99K to $236K
- Deduction, full range
- $67K to $254K
- Reclassified
- 31.3%
- Land allocation
- 18.4%
- Median modeled price
- $825,000
- State tax
- Decoupled or partial
Furnished mountain rentals near Bridger and the Big Sky feeder corridor, on the dataset's lowest land allocation. A small land share leaves more building basis for the study to work with, which is why Bozeman ranks above markets that cost far more.
Assumed in every Bozeman short-term-rental scenario: upgraded appliances, deck or patio, exterior fireplace, fire pit, garage, media room, hot tub, landscaping, conveyed washer and dryer, network equipment, security system, smart-home controls, structured cabling.
 5
5 Sedona, AZ Desert STR
- Median first-year deduction
- $198,591
- Its value at 37%
- $73,479
- Deduction, interquartile range
- $178K to $401K
- Deduction, full range
- $129K to $449K
- Reclassified
- 32.6%
- Land allocation
- 21.0%
- Median modeled price
- $1,185,000
- State tax
- Decoupled or partial
Desert short-term rentals on modest lots. Arizona is partially decoupled, so the state return sees less of the first-year acceleration than the federal one does.
Assumed in every Sedona short-term-rental scenario: upgraded appliances, deck or patio, fencing, fire pit, garage, built-in grill, hot tub, landscaping, conveyed washer and dryer, network equipment, security system, smart-home controls, structured cabling. Scenarios at or above the market median price also assume outdoor kitchen, pool, solar.
All 24 markets
Sorted by median first-year deduction. Every market links to its dedicated resource site with neighbourhood-level detail, regulatory context and a local FAQ. Each statistic is a median across that market's five scenarios computed separately, so multiplying the displayed medians does not reproduce the displayed deduction.
| # | Market | Cohort | Deduction | At 37% | Deduction IQR | Reclassified | Land | Modeled price | State tax |
|---|---|---|---|---|---|---|---|---|---|
| 1 | 30A, FL | Coastal STR | $418,487 | $154,840 | $265K–$459K | 37.7% | 25.2% | $1,485,000 | No state income tax |
| 2 | Park City, UT | Mountain ski STR | $280,283 | $103,705 | $169K–$289K | 27.9% | 50.0% | $1,450,000 | Conforms to federal bonus |
| 3 | Breckenridge, CO | Mountain ski STR | $231,779 | $85,758 | $227K–$280K | 26.2% | 25.2% | $1,325,000 | Conforms to federal bonus |
| 4 | Bozeman, MT | Mountain ski STR | $219,397 | $81,177 | $99K–$236K | 31.3% | 18.4% | $825,000 | Decoupled or partial |
| 5 | Sedona, AZ | Desert STR | $198,591 | $73,479 | $178K–$401K | 32.6% | 21.0% | $1,185,000 | Decoupled or partial |
| 6 | Maui, HI | Coastal STR | $197,546 | $73,092 | $173K–$215K | 28.9% | 45.0% | $1,325,000 | Decoupled or partial |
| 7 | Destin, FL | Coastal STR | $186,976 | $69,181 | $136K–$231K | 26.9% | 24.5% | $825,000 | No state income tax |
| 8 | Naples, FL | Coastal STR | $181,007 | $66,973 | $167K–$192K | 26.7% | 25.2% | $985,000 | No state income tax |
| 9 | Tahoe, CA/NV | Mountain cabin STR | $158,998 | $58,829 | $148K–$258K | 26.8% | 35.7% | $1,050,000 | Decoupled or partial (CA shore) |
| 10 | Gatlinburg, TN | Smokies cabin STR | $152,693 | $56,496 | $126K–$159K | 30.7% | 20.0% | $595,000 | No state income tax |
| 11 | Pigeon Forge, TN | Smokies cabin STR | $142,166 | $52,601 | $102K–$146K | 31.4% | 20.0% | $565,000 | No state income tax |
| 12 | Savannah, GA | Historic urban STR | $138,619 | $51,289 | $122K–$147K | 25.6% | 18.4% | $685,000 | Decoupled or partial |
| 13 | Las Vegas, NV | Desert STR | $133,088 | $49,243 | $124K–$148K | 32.5% | 22.0% | $525,000 | No state income tax |
| 14 | Broken Bow, OK | Mountain cabin STR | $124,972 | $46,240 | $116K–$126K | 26.0% | 14.0% | $545,000 | Decoupled or partial |
| 15 | Big Bear, CA | Mountain ski STR | $124,234 | $45,967 | $99K–$146K | 32.5% | 35.7% | $595,000 | Decoupled or partial |
| 16 | Asheville, NC | Mountain cabin STR | $123,891 | $45,840 | $122K–$139K | 28.5% | 18.4% | $565,000 | Decoupled or partial |
| 17 | Los Angeles, CA | Metro + STR hybrid | $102,747 | $38,016 | $102K–$122K | 13.8% | 44.1% | $1,325,000 | Decoupled or partial |
| 18 | Denver, CO | Metro + STR hybrid | $93,918 | $34,750 | $87K–$97K | 15.9% | 28.6% | $745,000 | Conforms to federal bonus |
| 19 | Seattle, WA | Metro investor | $85,812 | $31,750 | $76K–$89K | 15.7% | 38.8% | $875,000 | No state income tax |
| 20 | New York City, NY | Metro investor | $82,886 | $30,668 | $73K–$102K | 13.6% | 32.6% | $985,000 | Decoupled or partial |
| 21 | Charlotte, NC | Metro investor | $70,226 | $25,984 | $55K–$83K | 14.2% | 18.0% | $625,000 | Decoupled or partial |
| 22 | Dallas, TX | Metro investor | $58,634 | $21,695 | $56K–$69K | 14.1% | 22.0% | $525,000 | No state income tax |
| 23 | Houston, TX | Metro investor | $53,264 | $19,708 | $50K–$64K | 14.4% | 20.0% | $485,000 | No state income tax |
| 24 | Chicago, IL | Metro investor | $50,947 | $18,850 | $48K–$76K | 13.5% | 25.0% | $545,000 | Decoupled or partial |
Source: Cost Seg Smart STR Cost Segregation Benchmarks by U.S. Market 2026. Download the per-market CSV, or the per-scenario CSV with the assumed amenities.
Three markets that are easy to misread
30A: the outlier, and why not to anchor on it
30A (median first-year deduction $418,487, 37.7% reclassified) sits at the top of every aggregate here. The number reflects a specific combination: luxury beachfront single-family inventory at a median modeled price of $1,485,000, furnished for the rental market and assumed to carry a pool, a screen enclosure and an outdoor kitchen, in a state with no income tax. Its five scenarios run from $100K to $591K. A 30A property is not a $418,487 result; it is a property whose result the engine will place somewhere in that range, and only if it actually has those amenities.
Naples: the wide range is genuine
Naples shows a full range of $50K to $246K and an interquartile range of $167K to $192K because the city contains genuinely different sub-markets: gulf-front mid-rise condo, master-planned villa communities, and inland single-family at a fraction of the price. The median of $181,007 is a real number, and so are both tails.
New York City: this market often does not pencil
New York City (median first-year deduction $82,886, 13.6% reclassified, 32.6% land) sits near the bottom of the dataset. Local Law 18 effectively ended absentee short-term rental operation in the city, so the furnished-rental profile that drives high reclassification elsewhere is largely unavailable, and the engine treats the typical property as a long-term rental. Add New York's partial decoupling from federal bonus depreciation and a combined top marginal rate above 14%, and the after-tax case for a study on a typical NYC investment property is often marginal. The same lighter version of this note applies to Los Angeles, Maui, Seattle and Chicago, each of which restricts absentee short-term rental operation.
How the numbers are produced
- Scenario definition. Each market has five representative scenarios defined by address, property type, purchase price, year built, square footage and rental mode, chosen to span the market's typical range.
- Assumed amenities. Each scenario is given the amenities typical of a rental of that kind in that market: a base set every short-term-rental scenario carries, plus a signature set for scenarios priced at or above both the market median and $800,000. Long-term-rental scenarios get an unfurnished set; condo scenarios get only what a unit owner owns. The per-scenario list is published in fixtures.csv and summarised on each market card above. A scenario without amenities is not a neutral scenario, it is a bare house, which is why the earlier version of this dataset understated furnished rentals.
- Engine run. Each scenario is run through the Cost Seg Smart engine, version 3.185.0, the same path that produces customer studies, on the retail classification lane.
- Base costs. Industry-standard 2026 construction cost data by component category.
- Time index. BLS Producer Price Index (construction materials, series WPUFD49207) adjusts 2026 costs to acquisition-date dollars.
- Geographic factor. Six-tier resolver: pinned metros, calibrated, manual, state, region, national default.
- Land allocation. County assessor records where the reliability gate passes; statistical fallback otherwise. A premium land floor applies when the reconciliation factor indicates land-dominant value.
- MACRS classification. IRS Publication 946 and Rev. Proc. 87-56.
- Bonus depreciation. 100%, for eligible assets acquired and placed in service after January 19, 2025. Every scenario assumes 2025-06-15.
- Federal tax benefit illustration. The first-year deduction multiplied by an assumed 37% top marginal bracket. State treatment reported separately per each state's conformity position.
Full engine methodology: costsegsmart.com/methodology.
Limitations
- These are engine outputs for modeled scenarios, not customer results. The scenarios were chosen to be representative; a specific building will land somewhere inside its market's range, and can land outside it.
- The amenity sets are assumptions, and they drive the result. A property without the assumed amenities produces a materially smaller deduction. On the same scenarios with no amenities at all, the all-market median first-year deduction is roughly a quarter lower and the median reclassified share falls by about six points. The assumptions are published per scenario so a reader can check them against a real property.
- The benefit figure is the gross first-year deduction times 37%. It is the 5-, 7- and 15-year property at 100% bonus, multiplied by the assumed rate. It is not net of the depreciation the property would have received in year one without a study, so it overstates the incremental benefit of commissioning one.
- The benefit figure assumes the deduction can be used in the year it is taken. For many rental owners that depends on the passive activity rules, material participation or real estate professional status. Actual results also depend on the taxpayer's marginal rate. Consult a qualified tax professional.
- Five scenarios per market is a small sample. Medians are stable to the cohort structure; the interquartile ranges are indicative rather than statistical. Each statistic is computed separately across the five scenarios, so the displayed medians do not reconcile arithmetically with one another.
- State conformity is verified as of publication and changes. Several states have revised their position more than once in the past decade.
- STR regulation is evolving. Markets with active restrictions (New York, Los Angeles, Maui, Seattle, Chicago) carry hold-period uncertainty that should be modeled into multi-year underwriting.
Citation and reuse
This dataset is released under CC BY 4.0. You may republish the tables and charts, including commercially, with attribution.
Cost Seg Smart Research Team. STR Cost Segregation Benchmarks by U.S. Market (2026): 120 Modeled Scenarios Across 24 Markets. Engine 3.185.0, 2026-09-07. https://costsegsmart.com/research/str-benchmarks-by-market-2026/
Download CSV (24 markets) Per-scenario CSV (120 rows) Download JSON
For interview requests, custom data slices or methodology questions: hello@costsegsmart.com.