What's inside a data center cost segregation report
Six-section structure for every Cost Seg Smart data center engagement — executive summary, engineering methodology, component allocation tables, equipment cross-references, §481(a) lookback workpaper, audit-defense appendix. Illustrative reclassification examples from $25M colocation and $15M enterprise worked examples on this site.
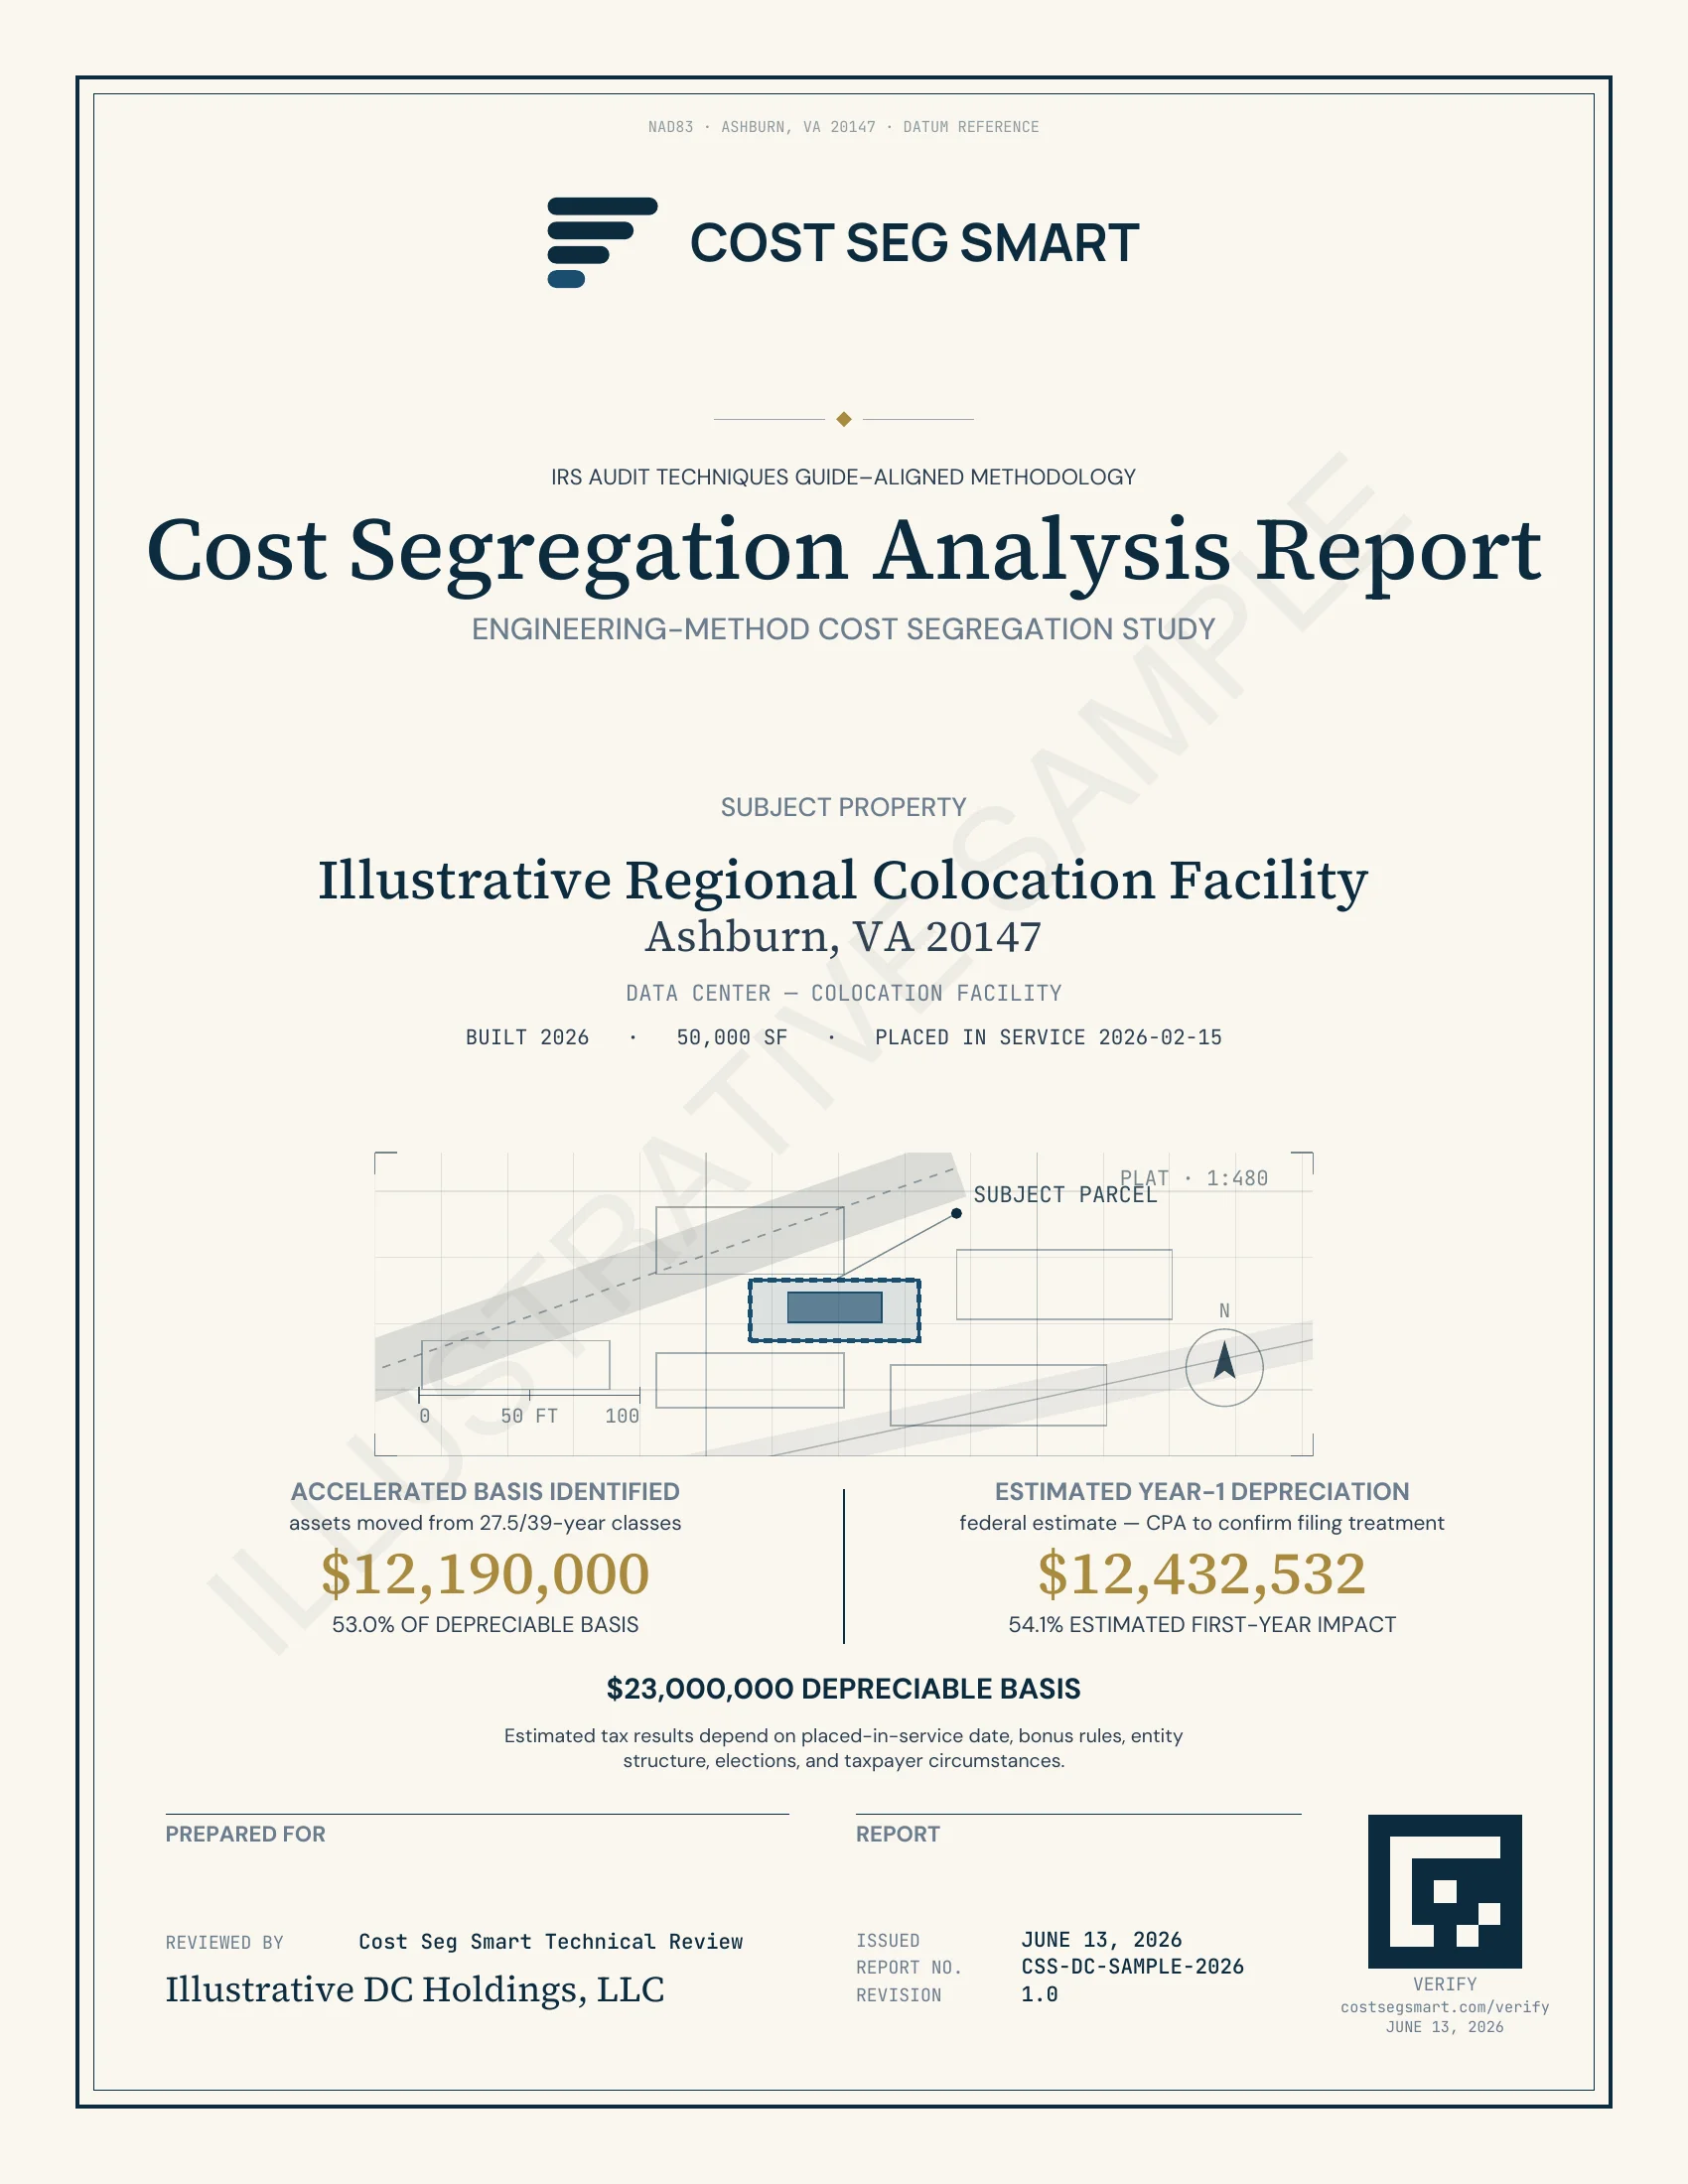
Note on this page: This describes the structure of the deliverable. A complete illustrative full-length sample report (a representative $26M / 50,000 SF colocation facility, ~53% reclassified, watermarked ILLUSTRATIVE SAMPLE and including the contracted-engineer sign-off page) is available through the sample request form. It is not a real customer's report — we don't publish anonymized customer reports without named-customer approval; when the first DC engagement closes with attribution, a redacted real sample will join it.
Inside the report: actual pages
Real pages from an illustrative data center study (a watermarked Ashburn, VA colocation sample, redacted where needed). This is the actual deliverable, not a brochure mockup. Click any page to open it full size.
The report itself
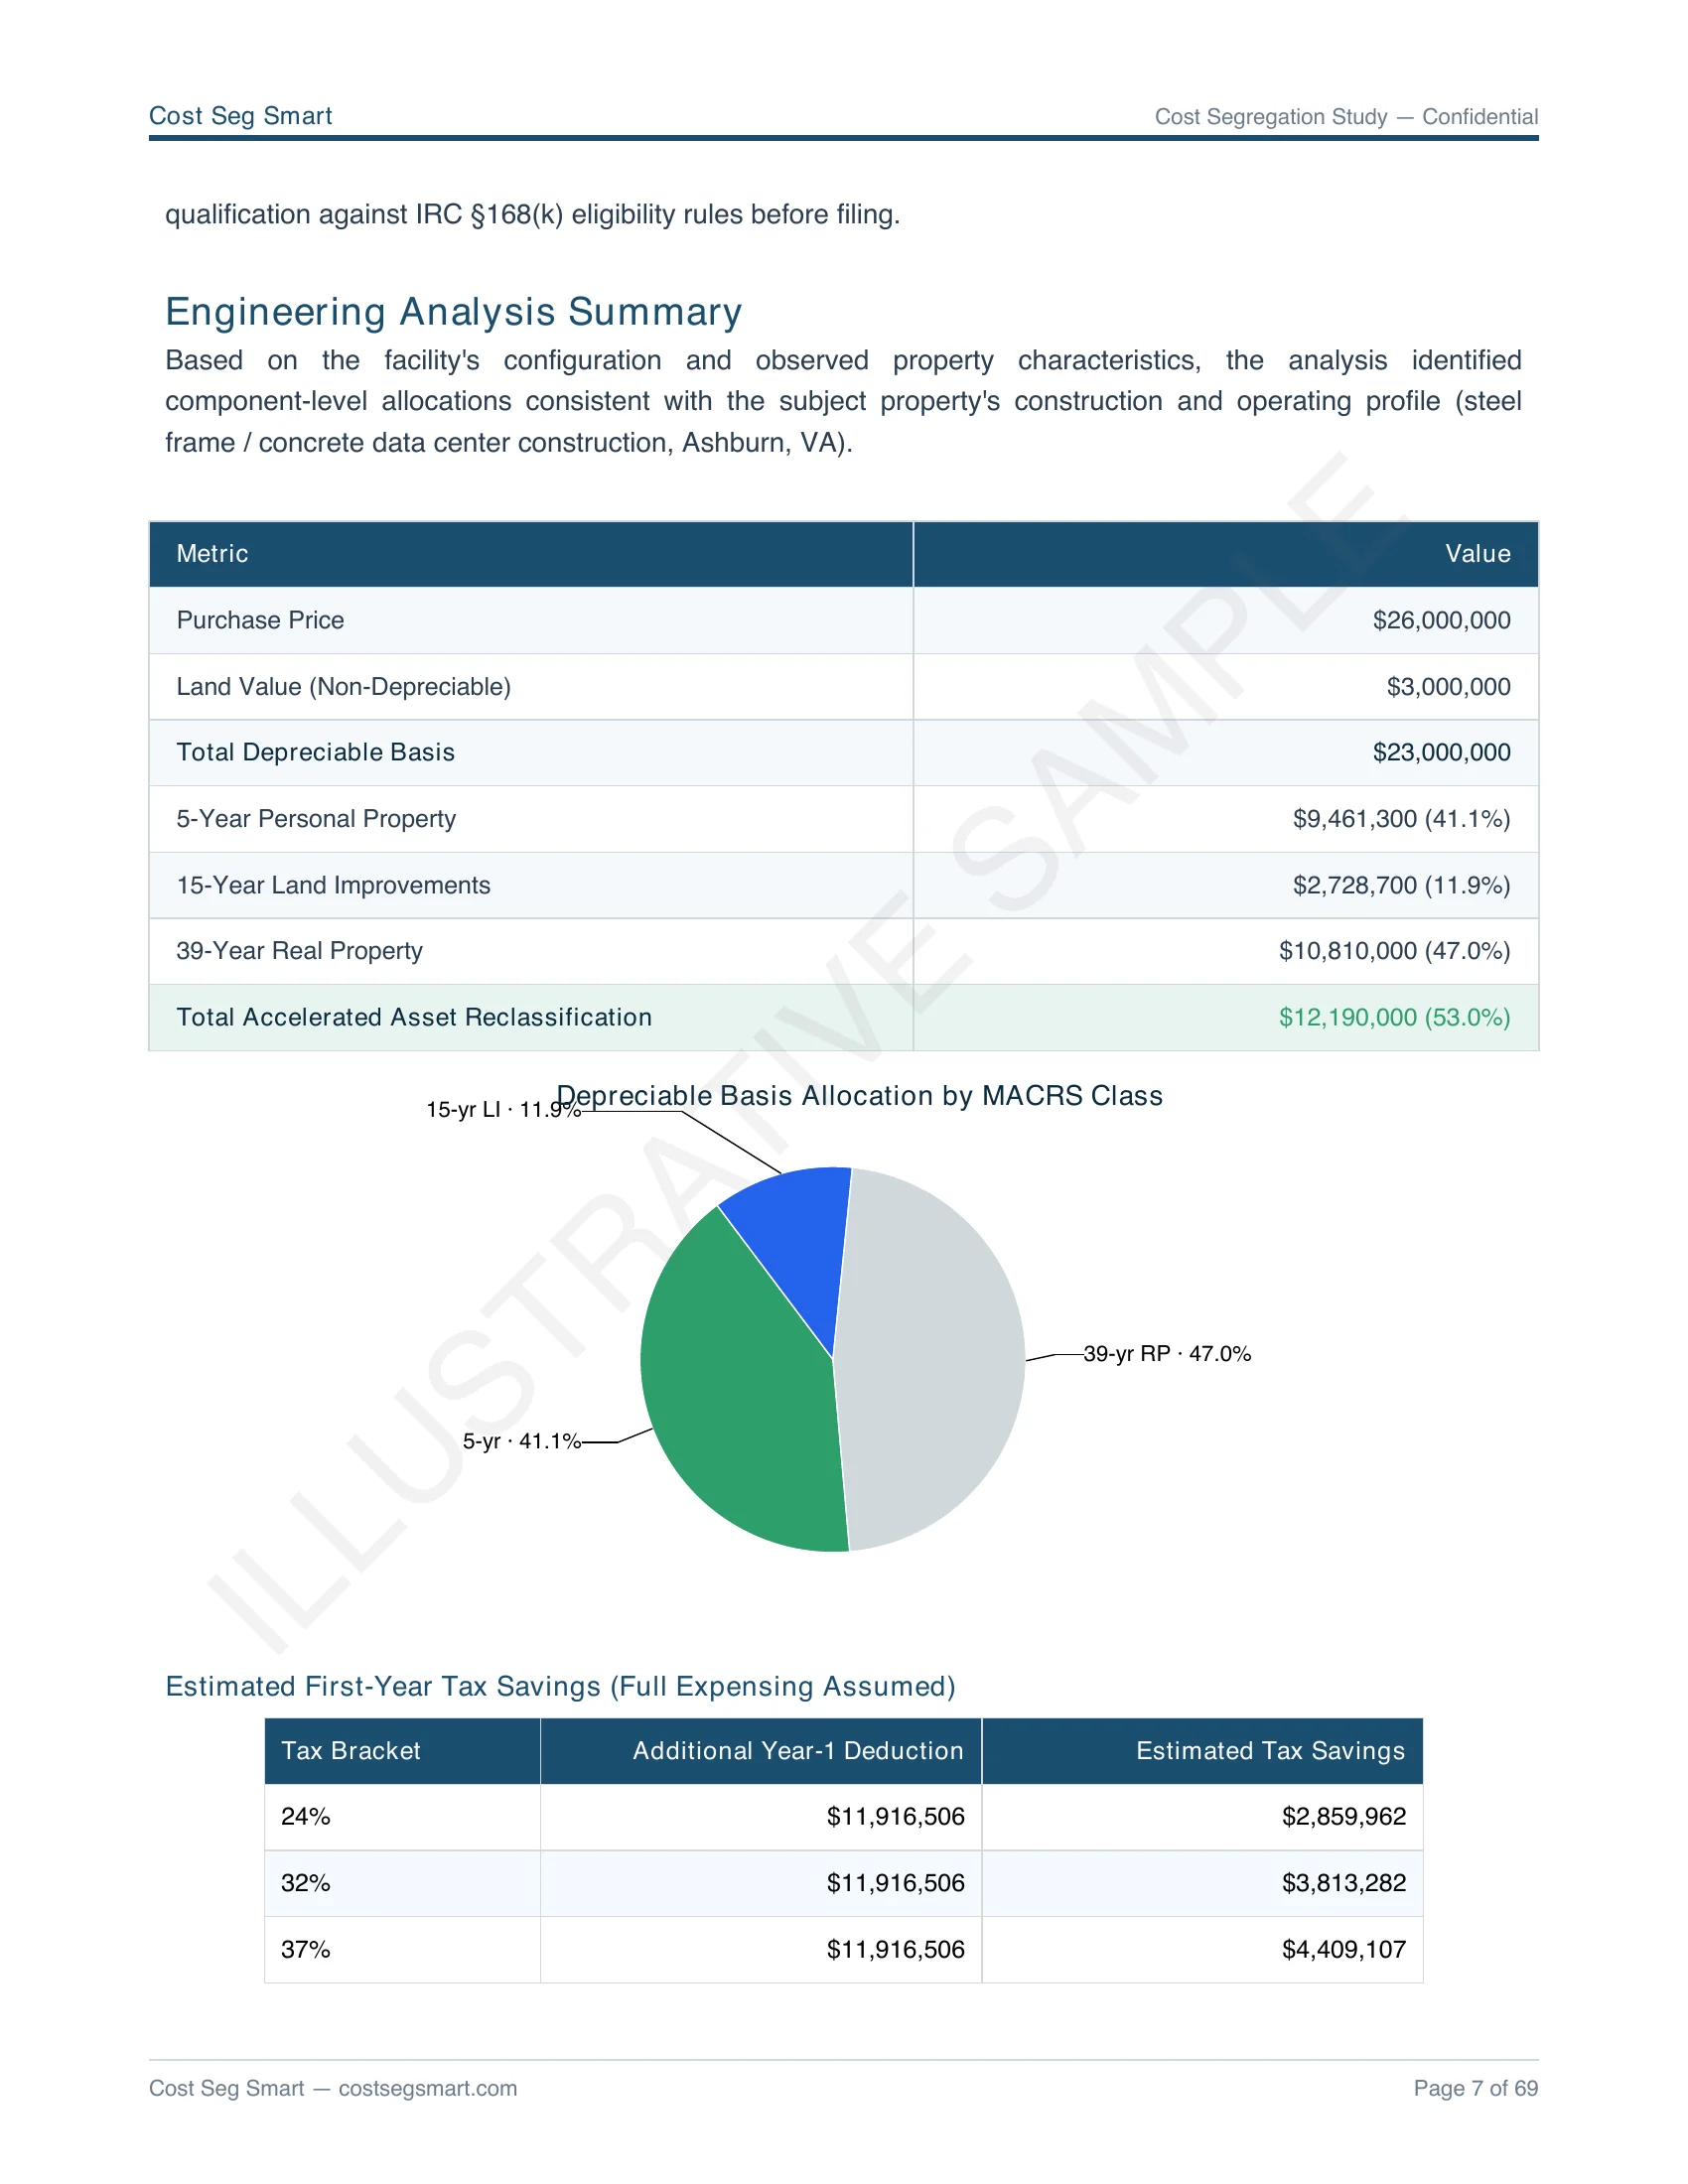
Engineering analysis summary
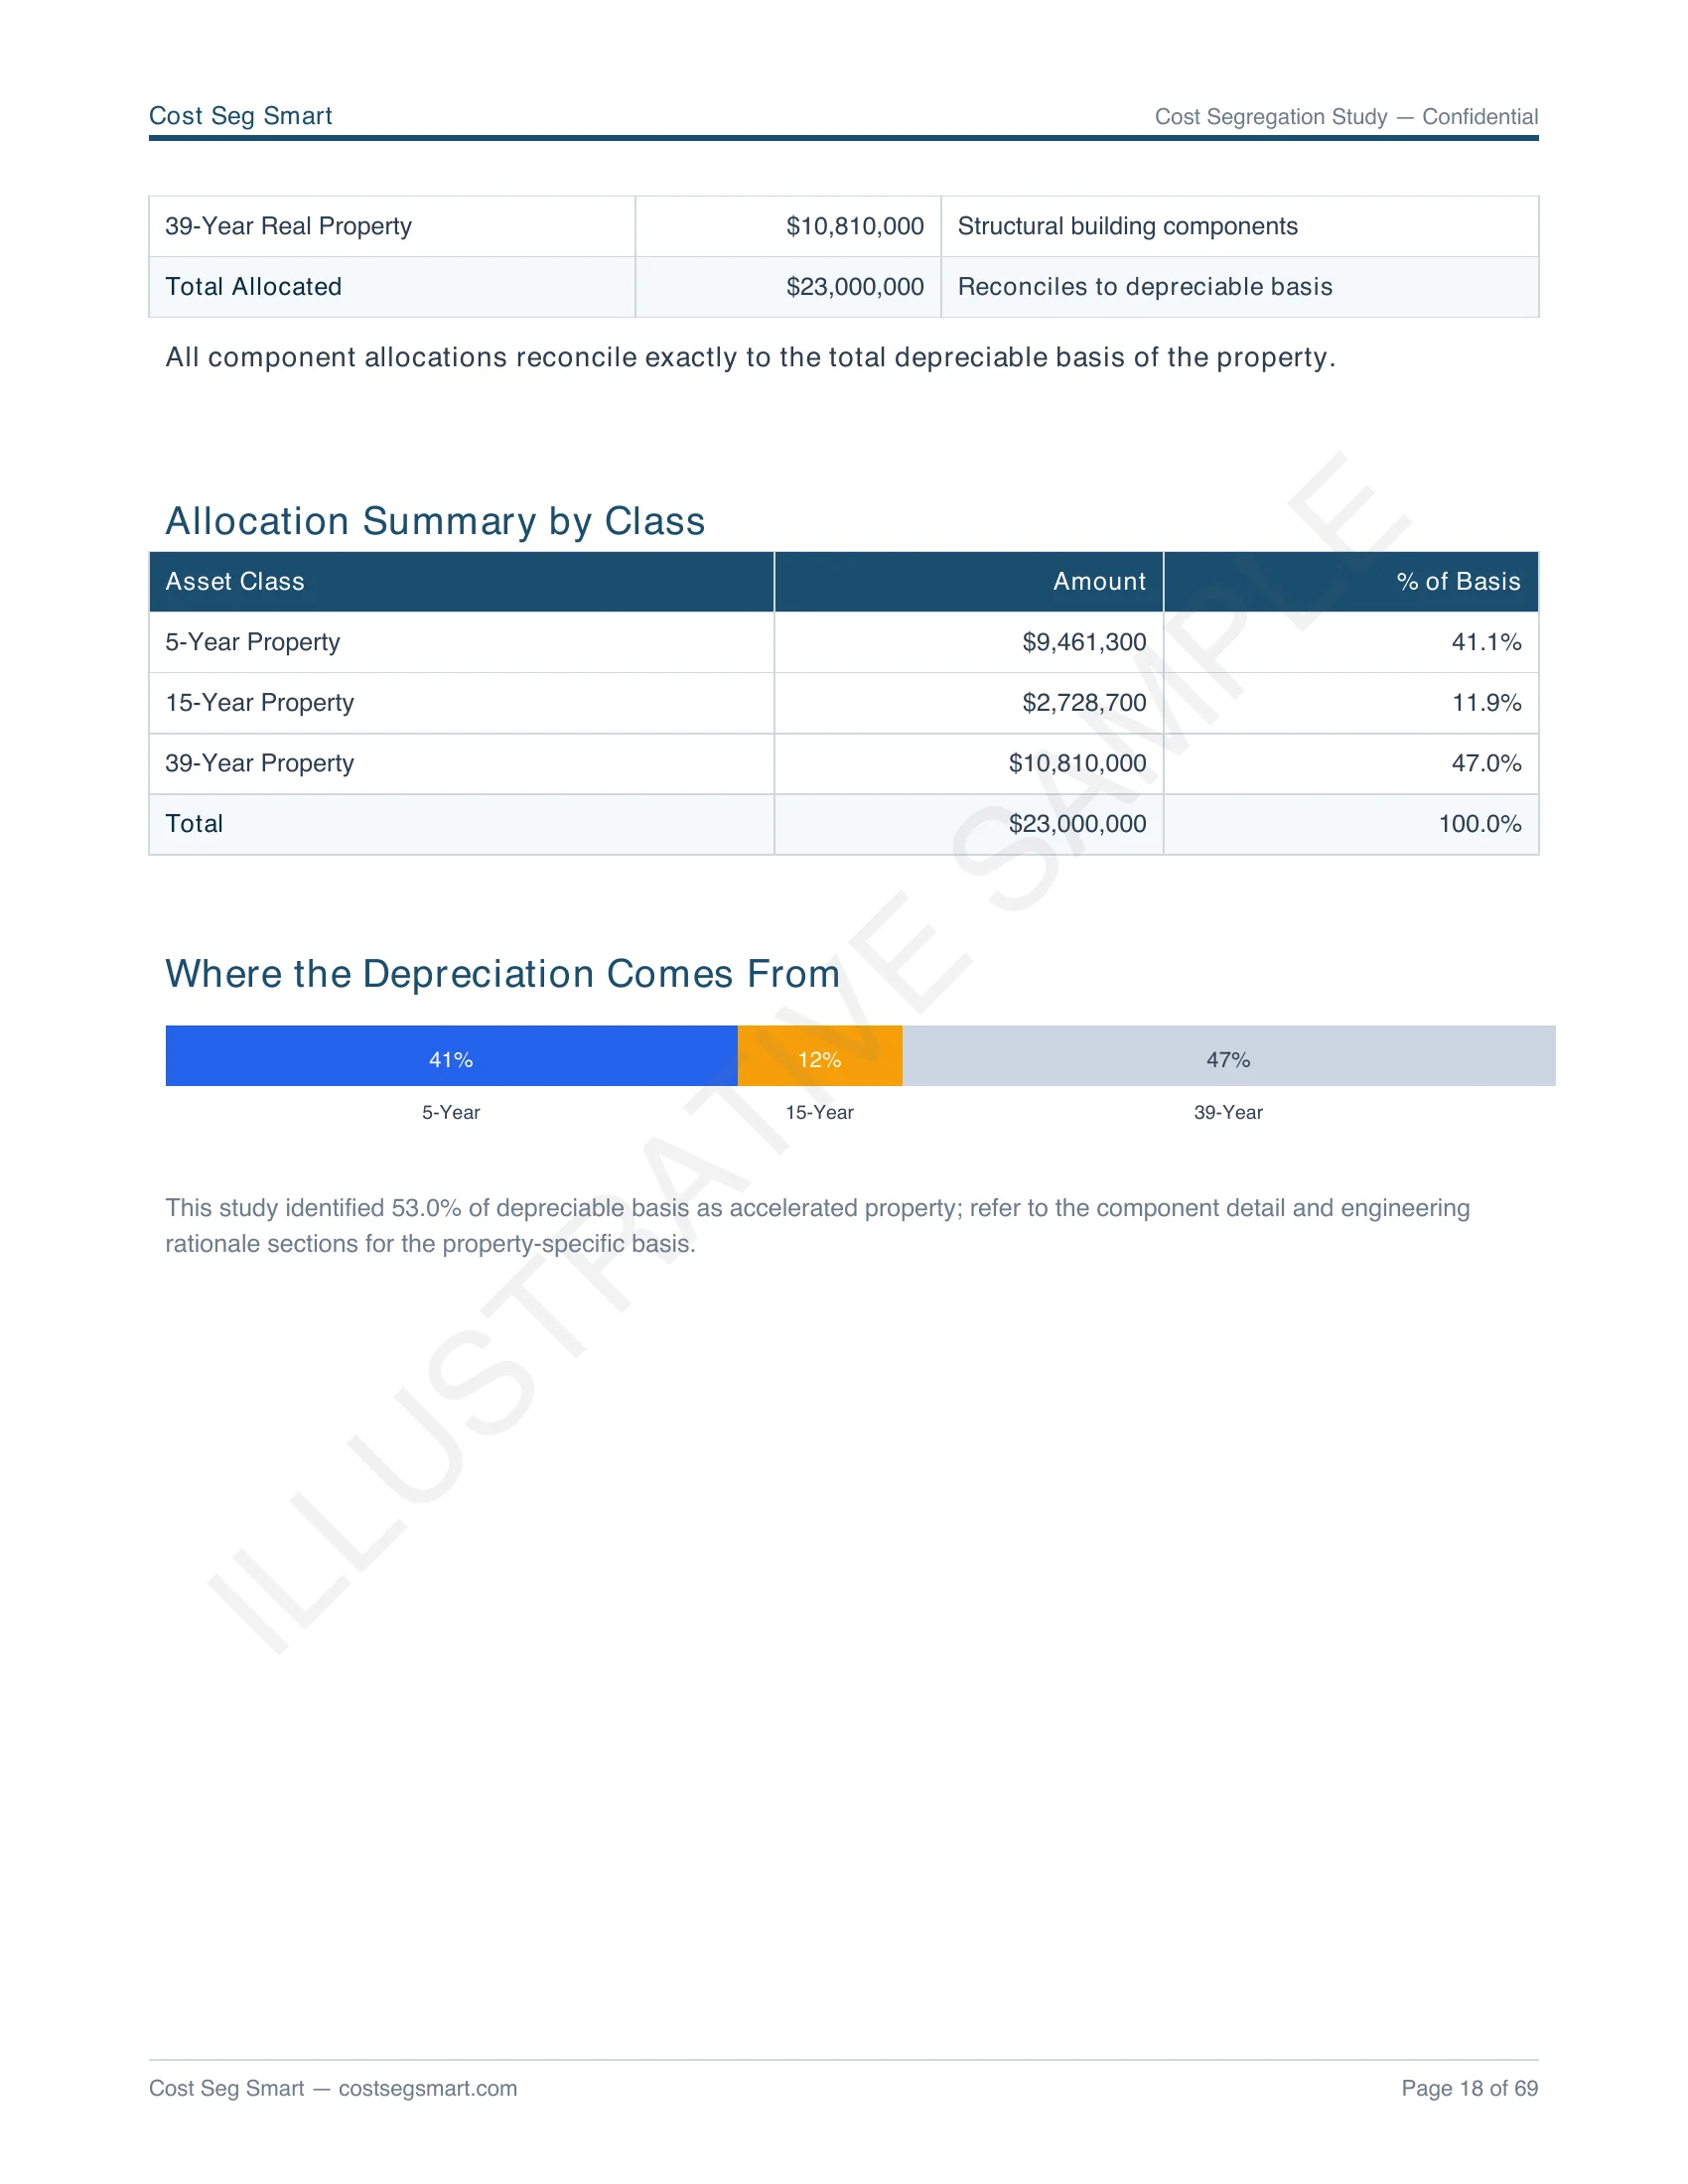
Allocation by asset class
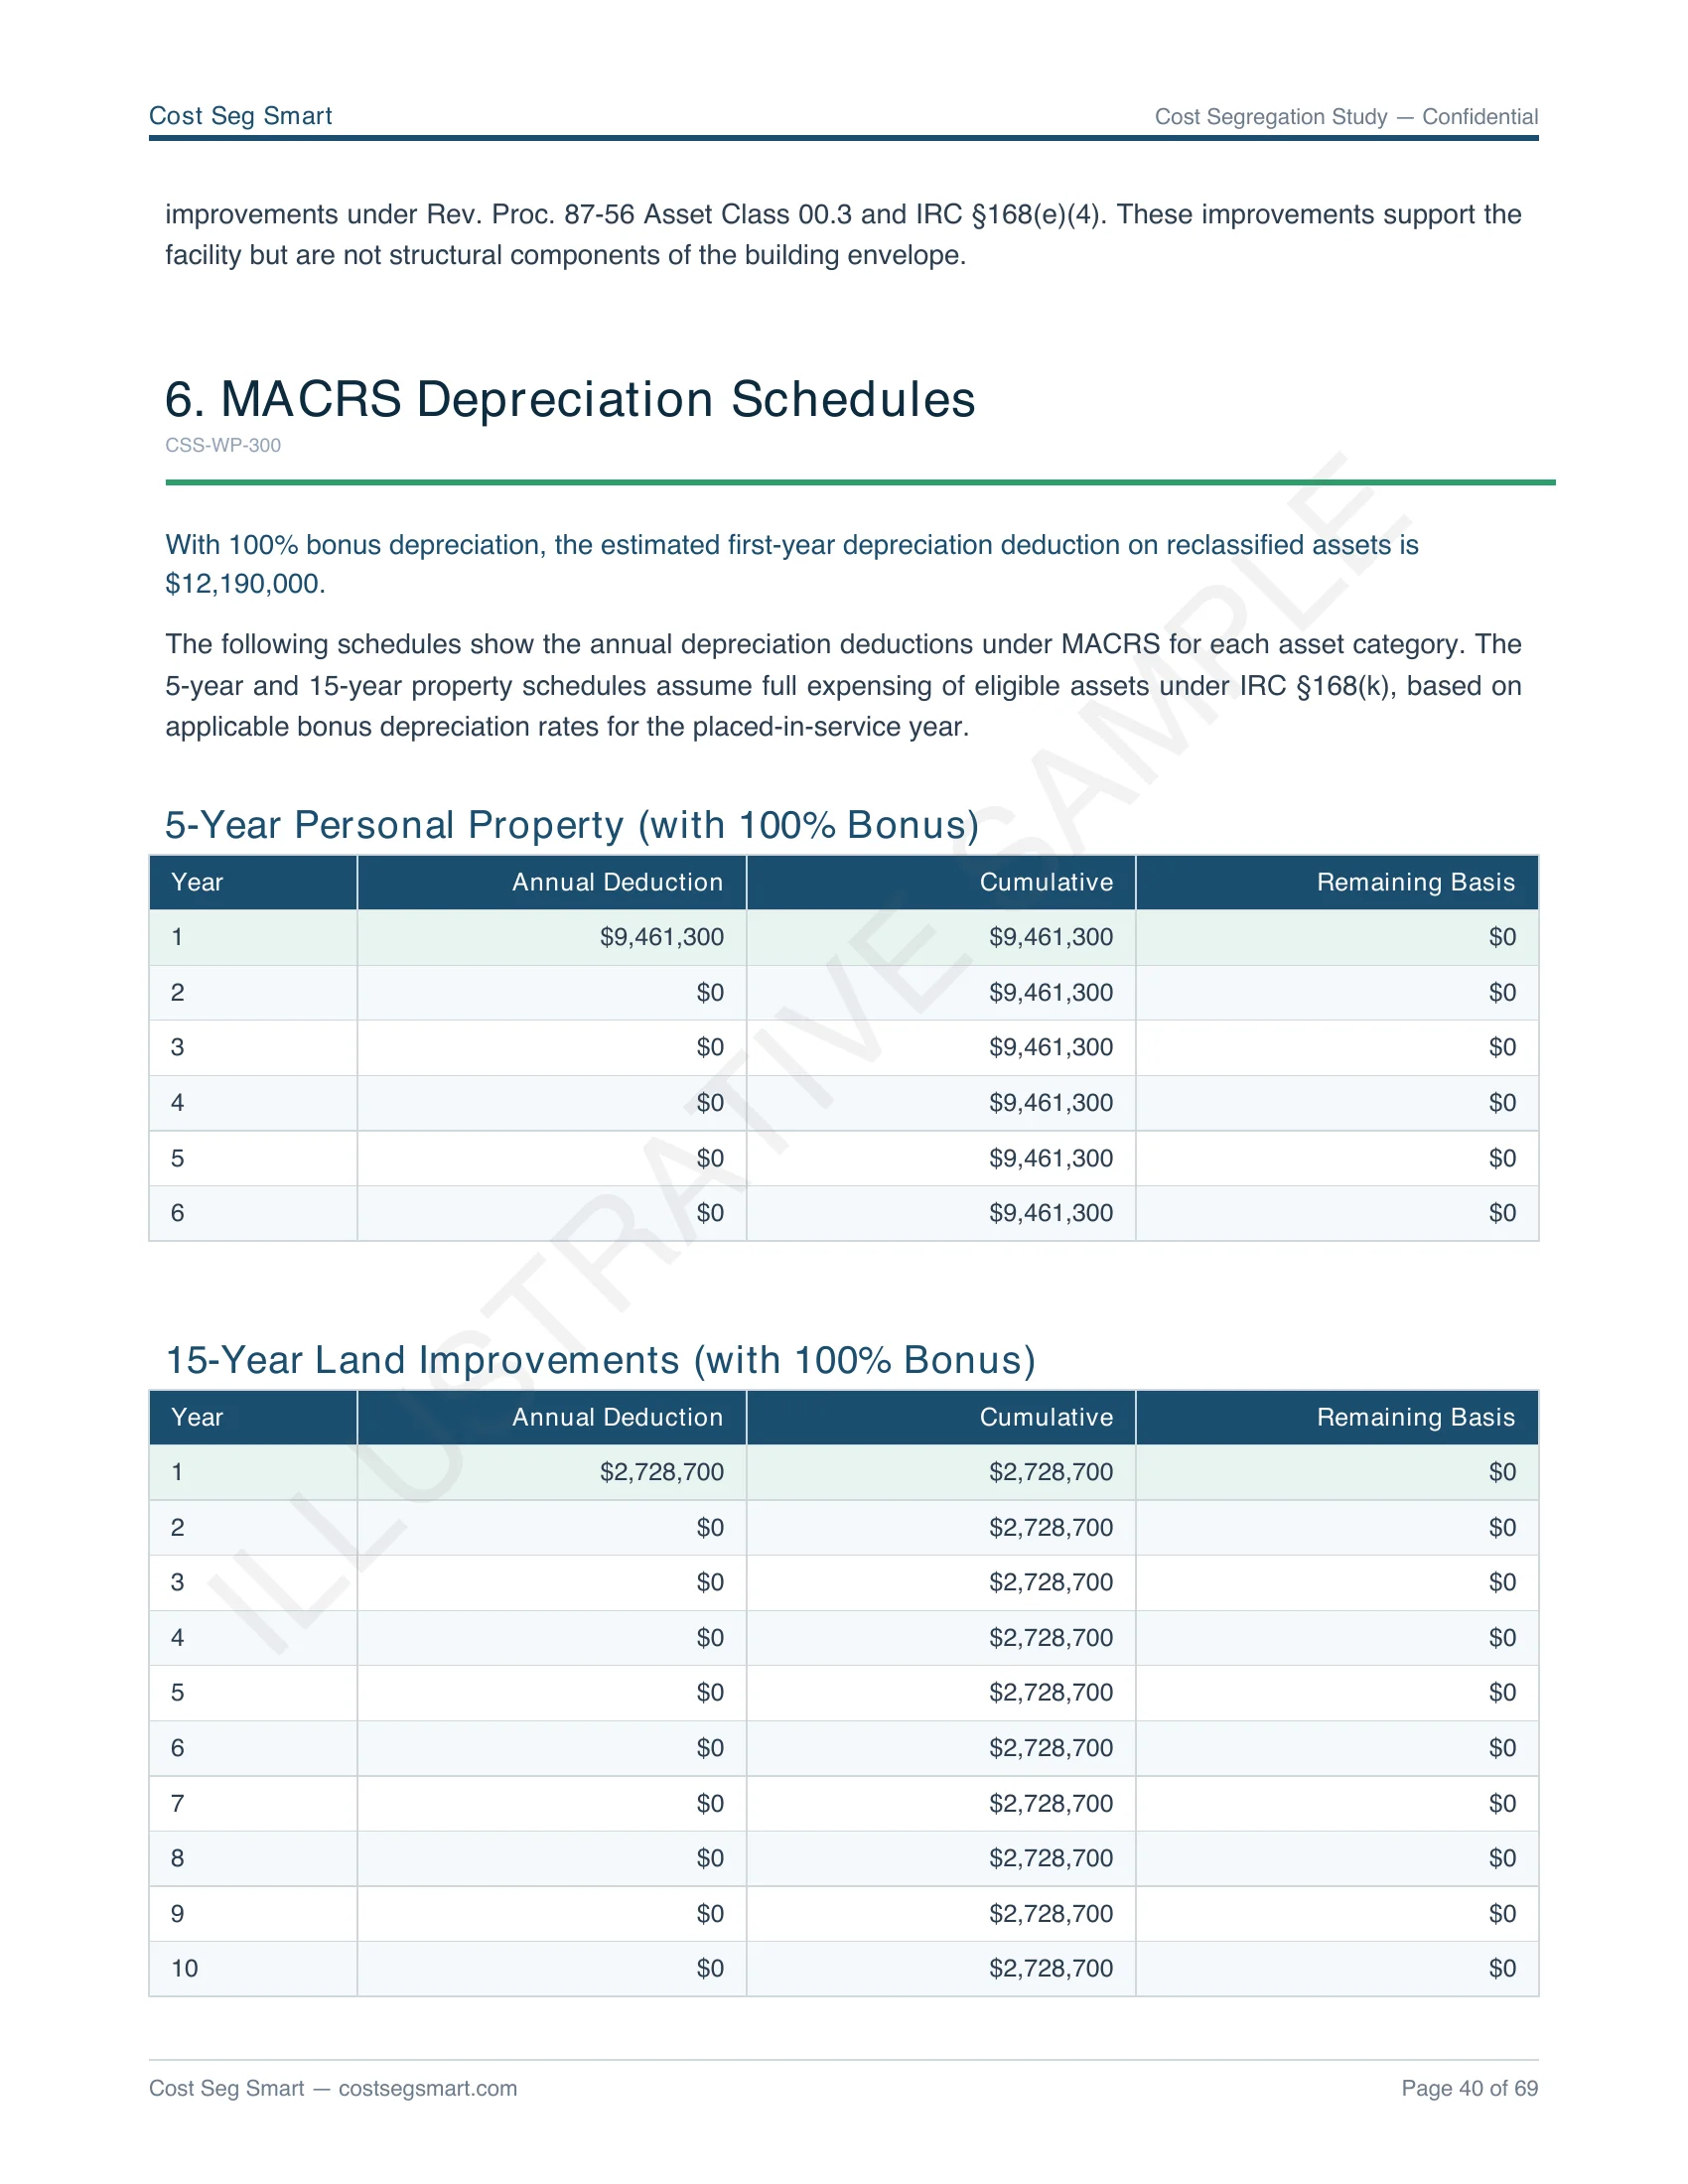
MACRS depreciation schedules
IRS methodology, addressed
Illustrative sample, not a benchmark. Actual reclassification varies with facility type, redundancy tier, equipment density, and other facts.
Six-section report structure
Every DC engagement delivers a 30–60 page engineering report (length scales with facility size + lookback complexity). The structure below is consistent across edge / colocation / enterprise / hyperscale engagements; depth and supporting workpapers scale to the engagement.
Executive summary
Property identification (basis, PIS date, depreciation period, taxpayer entity type), total reclassification % and dollar amount, year-1 deduction summary, audit-defense scope statement, internal technical review & QC sign-off. Designed as the single document your CPA / tax controller reviews before filing Form 4562.
Engineering methodology
Application of the Rev. Proc. 87-56 asset class framework to this specific facility. References to IRS Pub 5653 Chapter 7 examiner standards. Facility-process vs. building-shell threshold test applied per component. Documentation of industry-standard 2026 construction cost data sources used for basis allocation. The 13 principal elements of cost segregation per Pub 5653.
Component allocation tables
Line-by-line component classification for the facility. Each component identified, mapped to a Rev. Proc. 87-56 asset class, assigned a MACRS recovery period, and allocated a basis share derived from industry-standard 2026 construction cost data. Subtotals by class (5-year personal property / 15-year land improvements / 39-year building shell). Engineering rationale documented per component.
Equipment-list cross-references
Cross-references between customer-supplied equipment lists (UPS specs, CRAH/CRAC model numbers, PDU brands, generator capacities, security infrastructure) and the components in the allocation tables. Documents our technical interpretation of each equipment item. Supports examiner review on audit.
§481(a) lookback workpaper (when applicable)
For Form 3115 lookback engagements only. Hypothetical depreciation schedule (what cost-seg would have allowed in the original PIS year), actual claimed depreciation schedule (typically 39-year straight-line), and cumulative §481(a) catch-up computation. Form 3115 line-by-line reference for tax preparer filing. Coordination notes for external-audit DTL discussion.
Audit defense appendix
Internal technical review reconfirming the classifications, cost-source citations per component, asset-class mapping with stated rationale, examiner-question response template, 36-month support scope statement. The workpaper pack that ships with the report and remains on file for 7+ years.
Illustrative component allocation — Section 3 examples
These are reused from worked examples already published elsewhere on this site — not customer reports. Real reports include line-by-line component classification (typically 40–80 line items per facility) with engineering rationale per row.
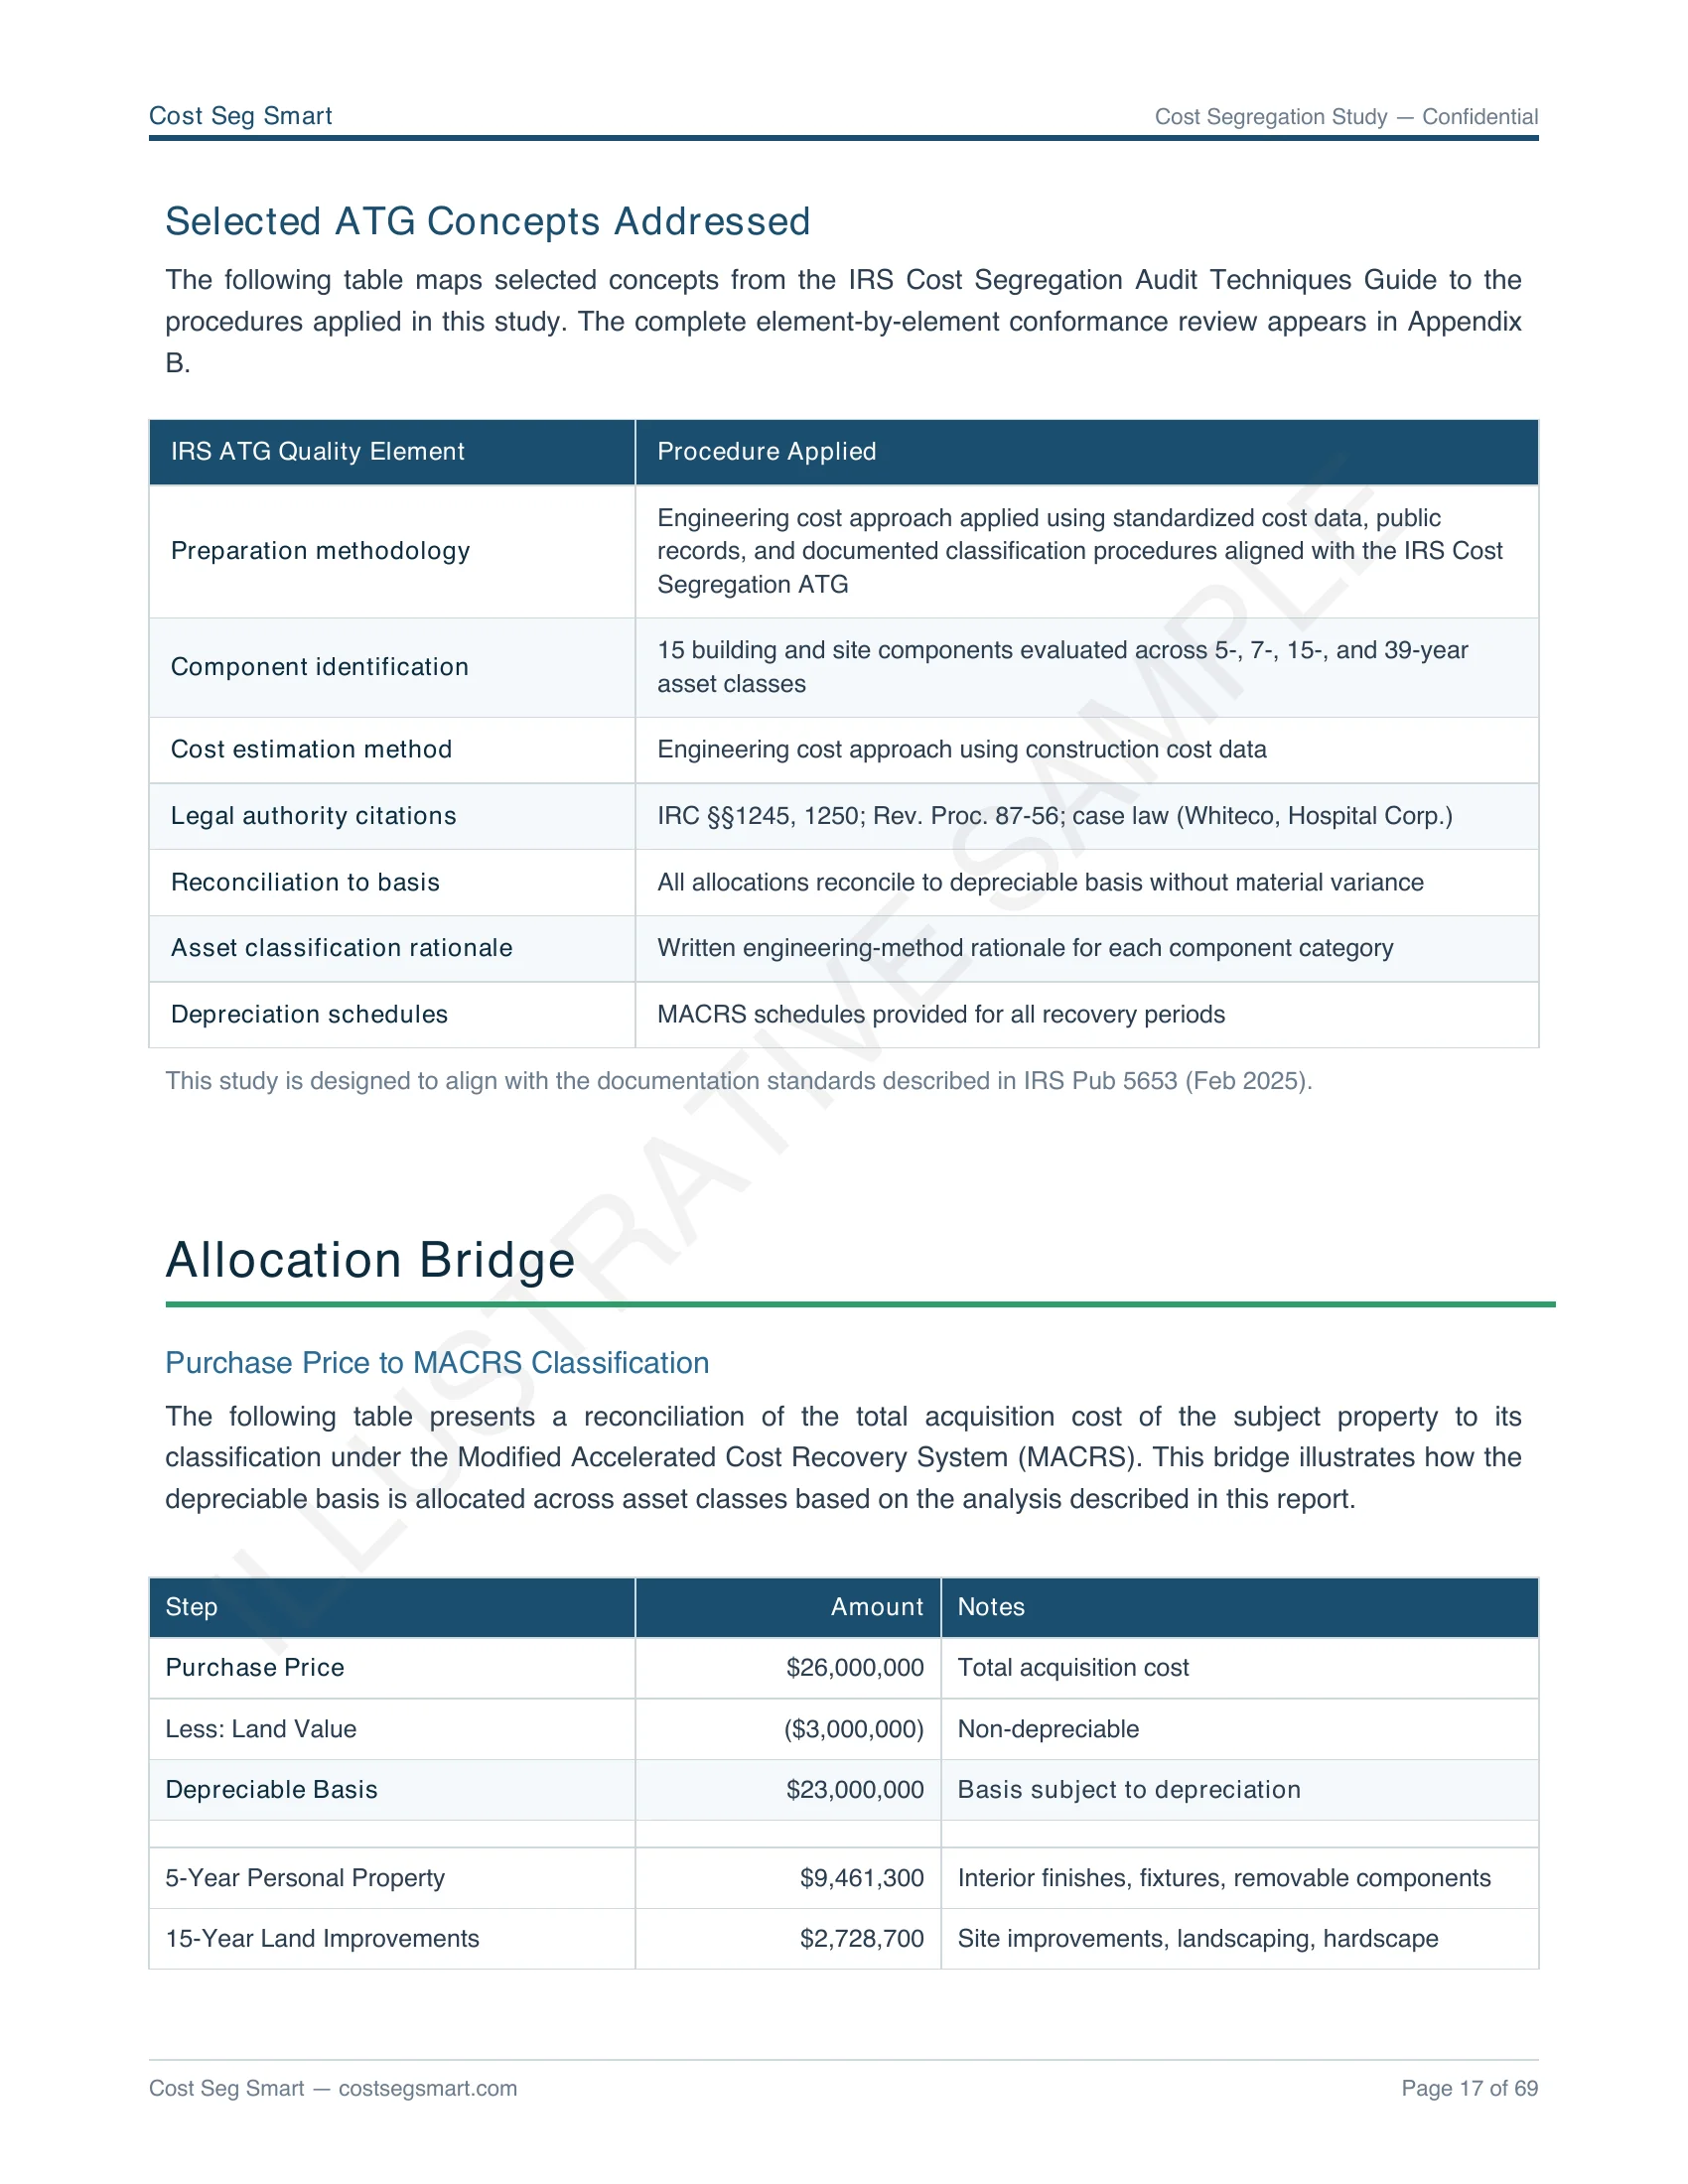
$26M regional colocation facility ($3M land, $23M depreciable basis)
| MACRS class | Basis share |
|---|---|
| Personal property (5-yr) UPS + battery plant, PDU/branch distribution, CRAH/CRAC precision cooling, racks/cabling, clean-agent fire suppression + VESDA, security, hot/cold-aisle containment | ~41% |
| Land improvements (15-yr) External chilled-water plant, cooling towers, pad-mounted generators, fuel storage, site switchgear, site work | ~12% |
| Building shell (39-yr) Structural slab, walls, roof, envelope, base-building human-comfort HVAC, life-safety electrical | ~47% |
Total reclassifiable: ~53% = $12,190,000 into accelerated MACRS. Year-1 deduction ~$12,190,000 with 100% OBBBA bonus on 5- and 15-year property (PIS 2026). Estimated federal tax savings ~$4,400,000 at 37% blended partnership rate.
$15M enterprise on-prem DC, healthcare for-profit
| MACRS class | Basis share |
|---|---|
| Personal property (5-yr) Concentrated in UPS, PDU, cooling, racks; lower site-improvements share at smaller scale | ~40% |
| Land improvements (15-yr) Site work + dedicated exterior infrastructure | ~10% |
| Building shell (39-yr) Shell-heavy because enterprise on-prem facilities often have more office/general-purpose square footage | ~50% |
Total reclassifiable: ~50% = $7,500,000 into accelerated MACRS. With 2020 PIS, §481(a) cumulative catch-up surfaces ~$6,200,000 current-year deduction. Estimated federal tax savings ~$1,300,000 at 21% C-corp rate.
Tax-side numbers (estimated federal tax savings, §481(a) catch-up) are modeled at the assumed entity rate; actual depends on entity structure, state conformity to §168(k), partnership allocations under §704(b), passive-activity limits under §469, and at-risk basis under §465. Engineering reclassification % is objective; tax-side numbers are estimates. Verify with CPA before filing.
What makes a DC cost-seg report audit-defensible
The IRS Cost Segregation Audit Techniques Guide (Pub 5653) establishes 13 principal elements that an examiner reviews when challenging a study. Cost Seg Smart's DC report structure maps directly to those elements:
- Engineering analysis — Sections 2 + 3 of the report (methodology + component allocation tables)
- Component-level documentation — Section 3 + Section 4 (equipment-list cross-references)
- Cost derivation — industry-standard 2026 construction cost data line-item references throughout Section 3
- Asset-class mapping per Rev. Proc. 87-56 — Section 3 column headers, with stated rationale per component
- §481(a) computation (for lookback engagements) — Section 5 workpaper
- Audit-defense methodology — Section 6 appendix (internal technical review, examiner-question response template)
Plus the 36-month audit-defense scope at no additional charge: workpaper exhibits, examiner-question response, internal technical review reconfirming the report, §481(a) re-derivation if challenged. Full scope at /audit-defense/.
Report questions
Can I download a sample PDF?
Is the report structure the same for edge / colocation / enterprise / hyperscale engagements?
Does the report include Form 3115 itself, or just the workpapers?
Can the report be reviewed by our external auditor before we file?
What's the internal review vs. named-engineer signoff?
How long does the report remain valid for audit defense?
Engage on your facility — and we'll deliver this report against it.
Send closing statement + capex schedule + equipment lists. Preliminary modeling same-day; full report timeline calibrated to engagement size (1–3 weeks at sub-$25M; longer for hyperscale).
See all report examples · DC vertical hub · component methodology · audit defense · general sample report